Self-Distilled StyleGAN: Towards Generation from Interenet Photos
Supplementary Material
- Cluster Centers Visualization
- Our Results - Random Samples
- Editing (Section 5.3)
- Self-Filtering Qualitative Comparison (Section 5.1)
- Quantitative Comparisons - User Study (Sections 5.1, 5.2)
Cluster Center Visualization
We show random walks between our cluster centers in the latent space of various domains (see videos below). As can be seen, the cluster centers are highly diverse and captures well the multi modal nature of the data.
NOTE:
* Click on the "Play/Pause All" button below the videos to play and pause all the videos.
* Click on the videos for viewing them in full size.
| Lions | Dogs | Parrots | Potted Plant |
|---|---|---|---|
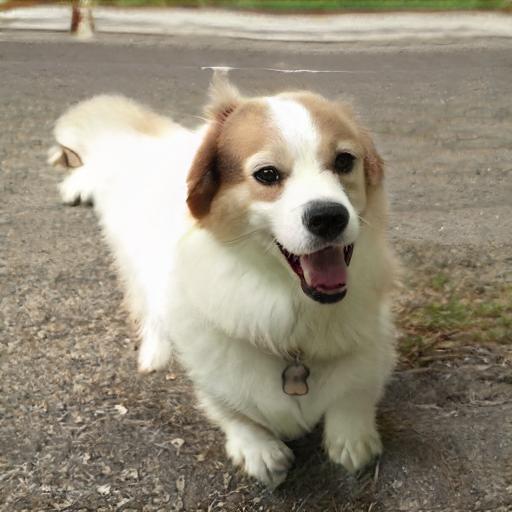
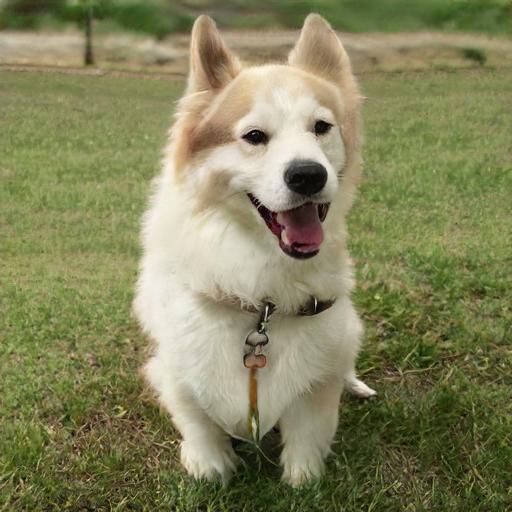
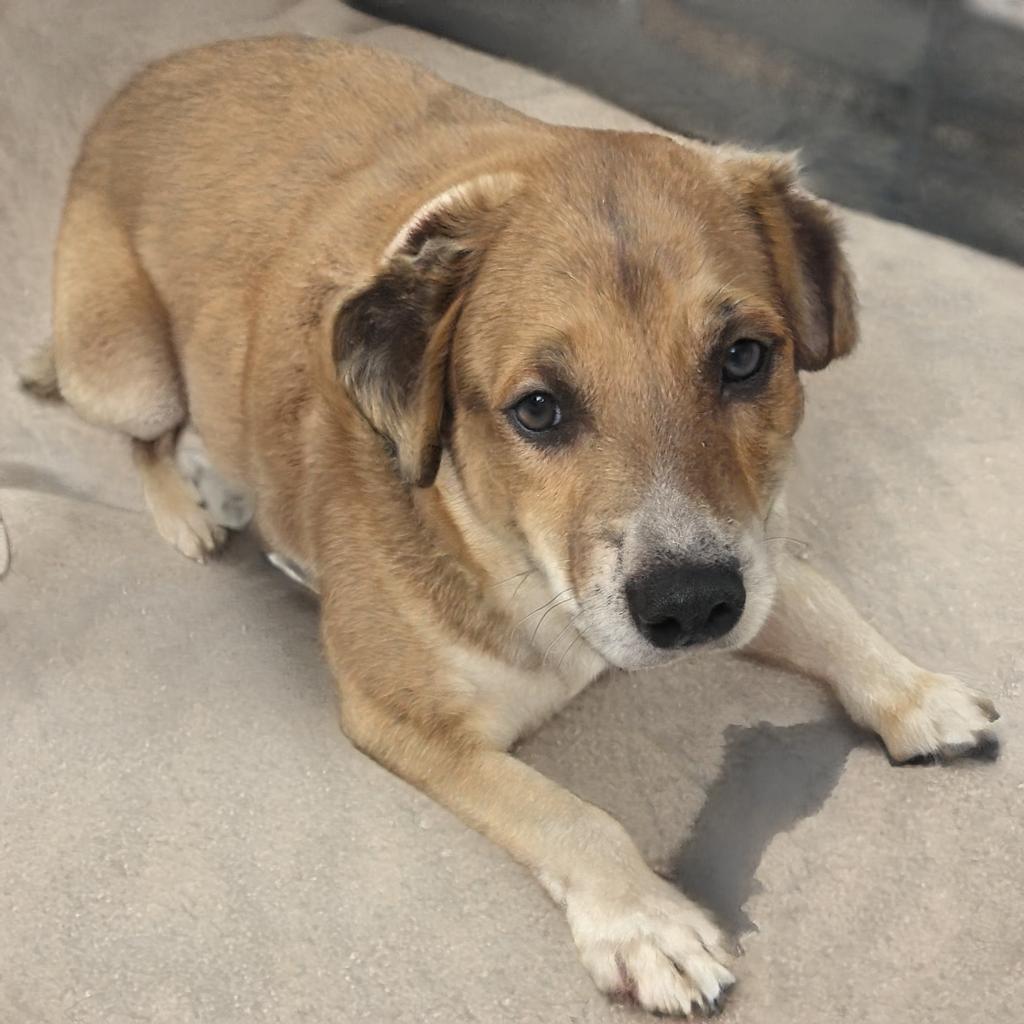
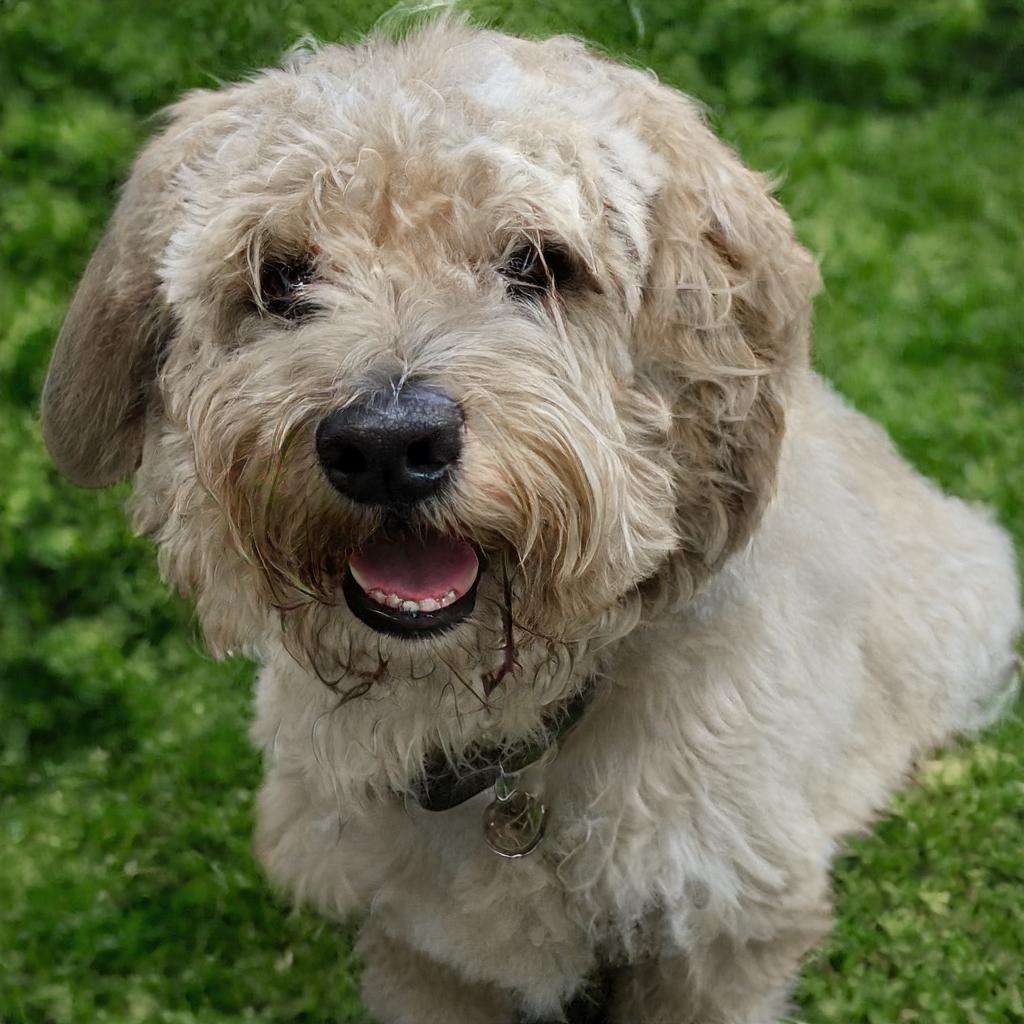
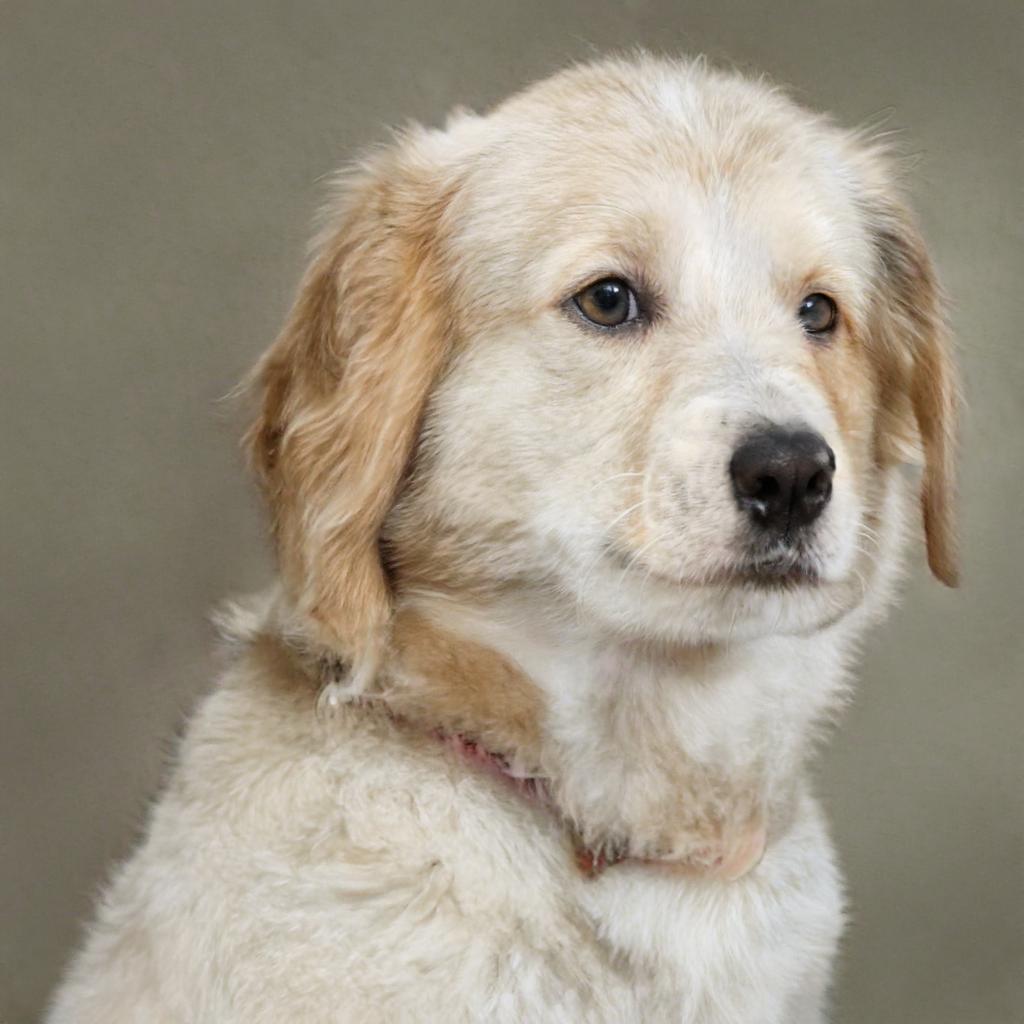
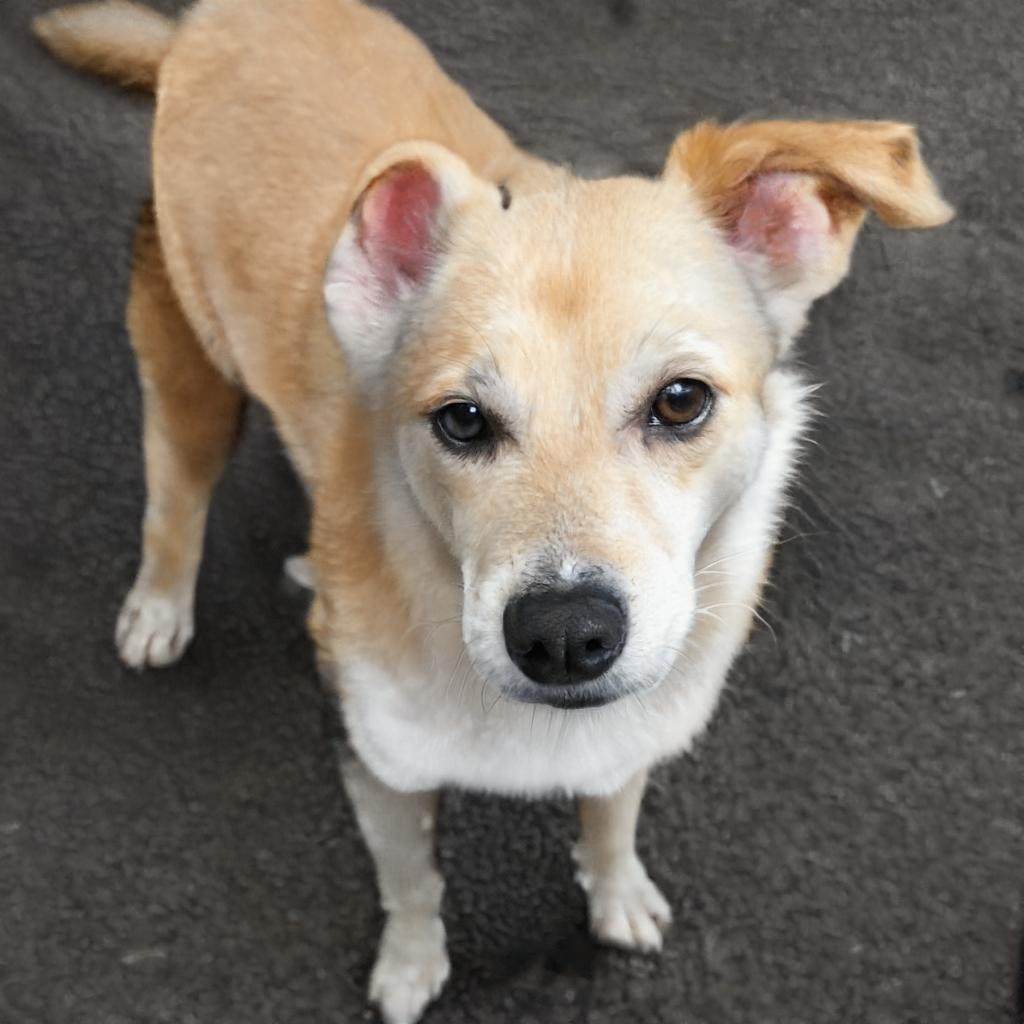
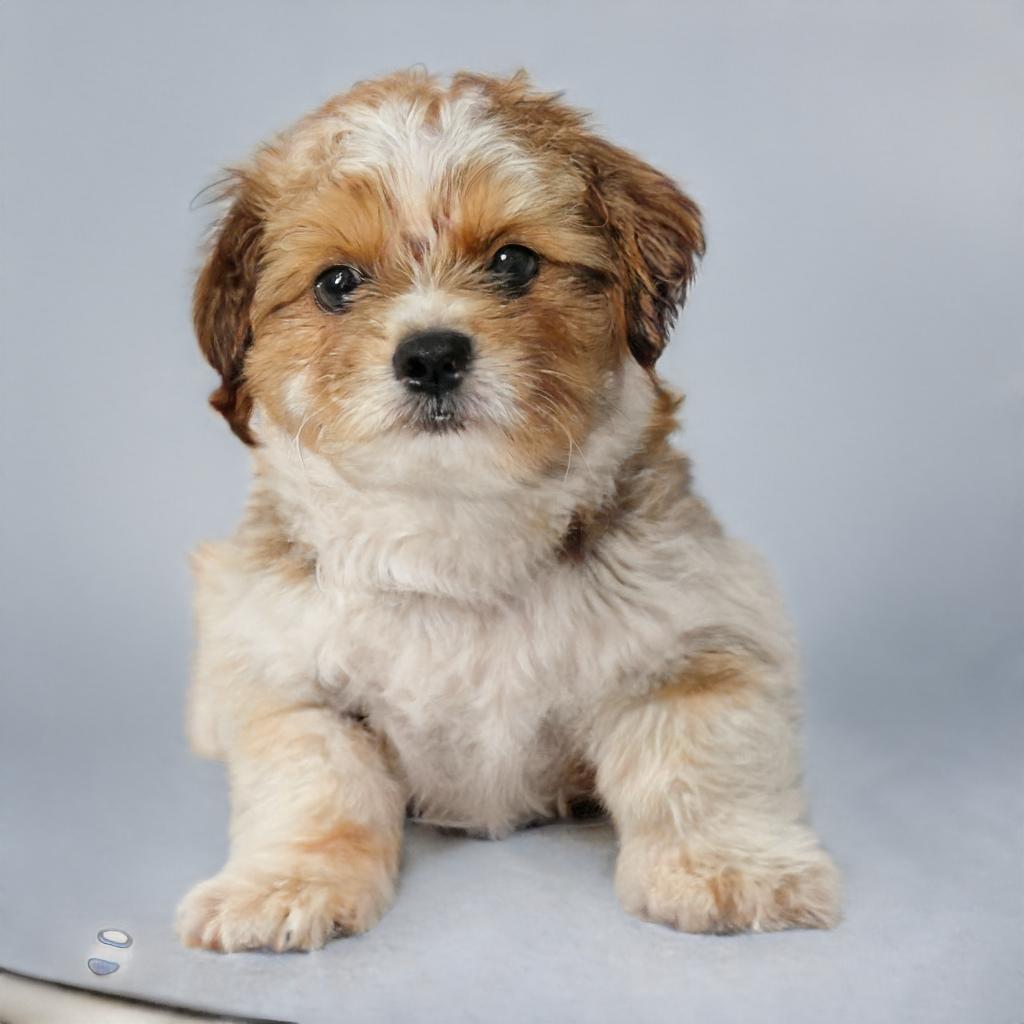
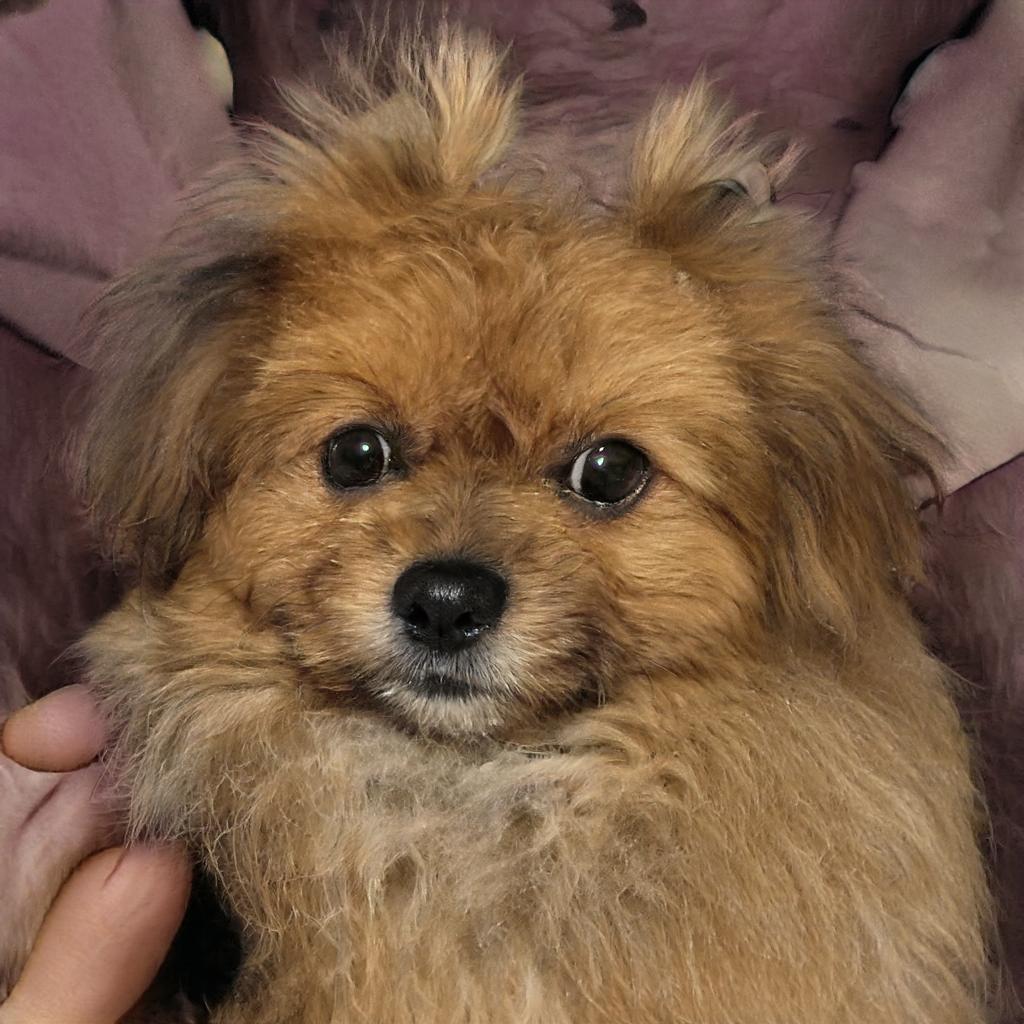
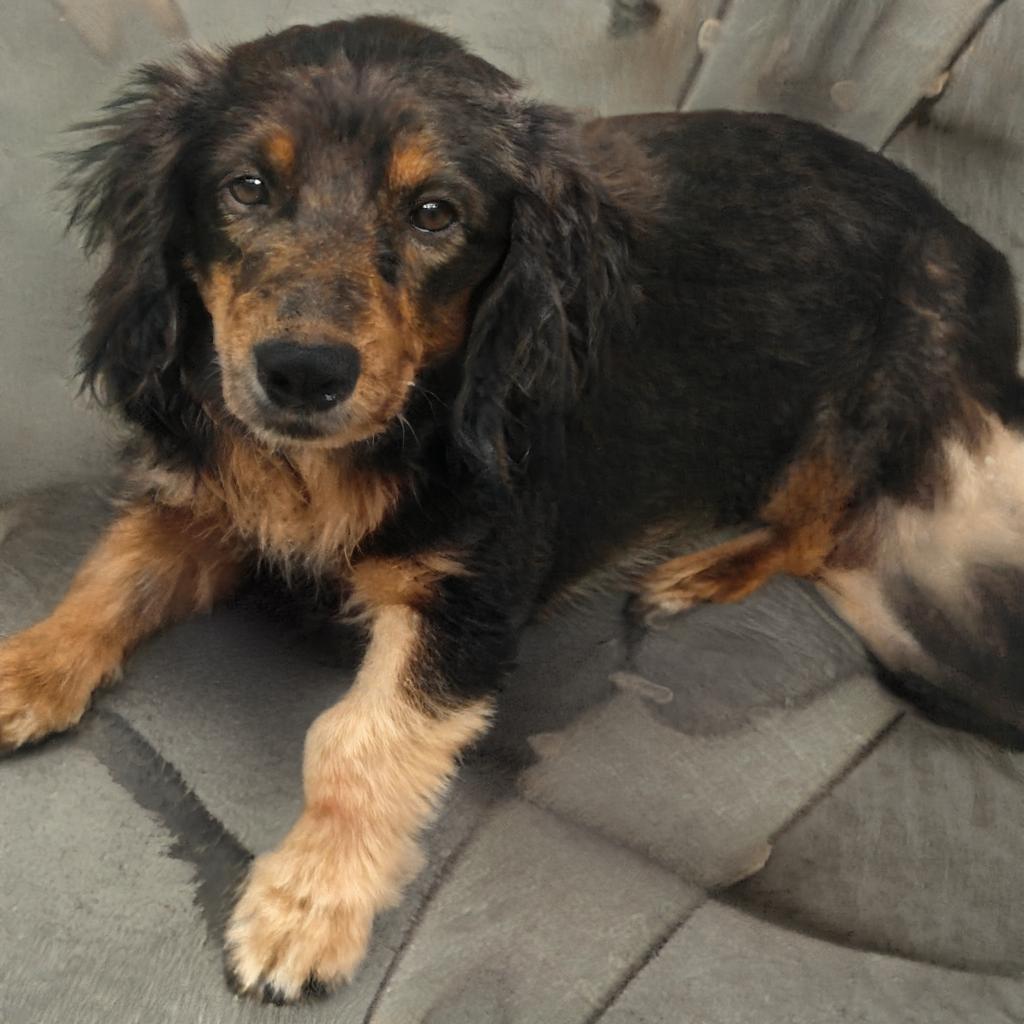
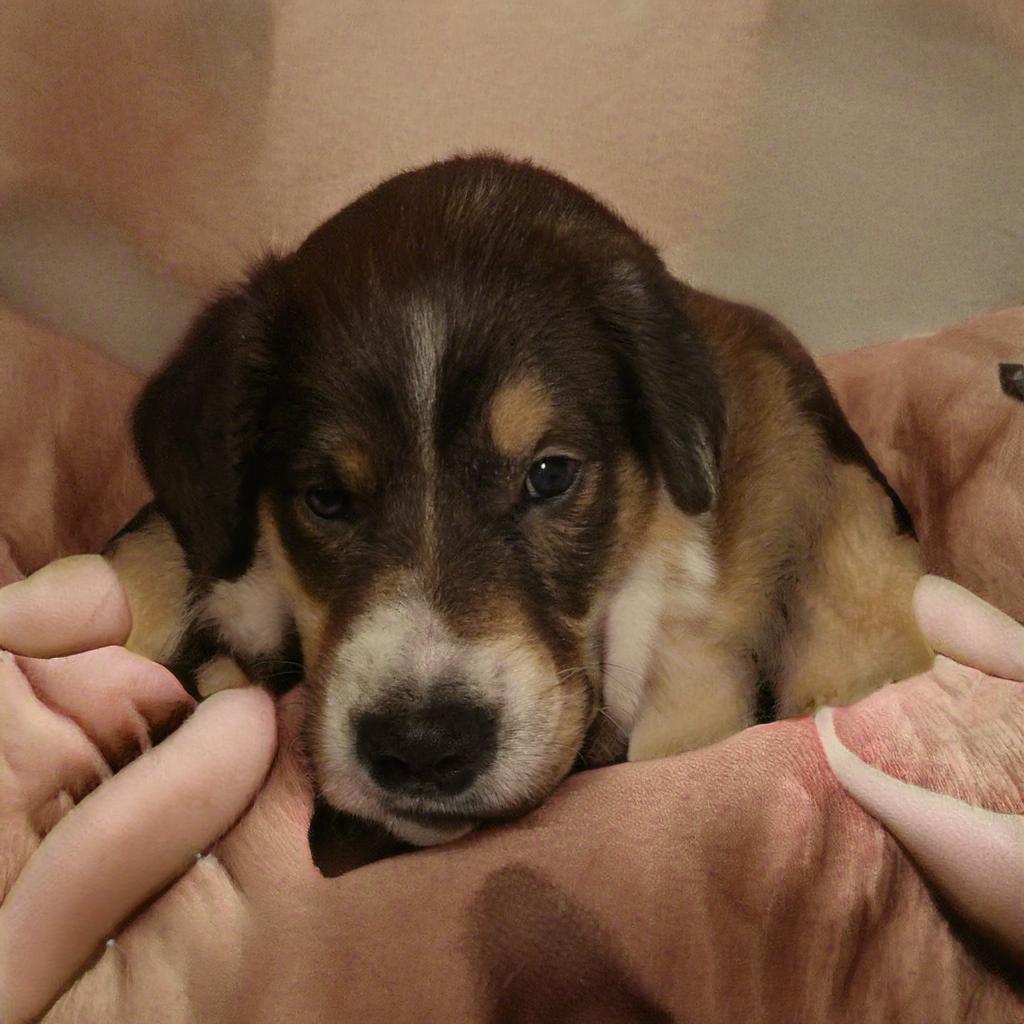
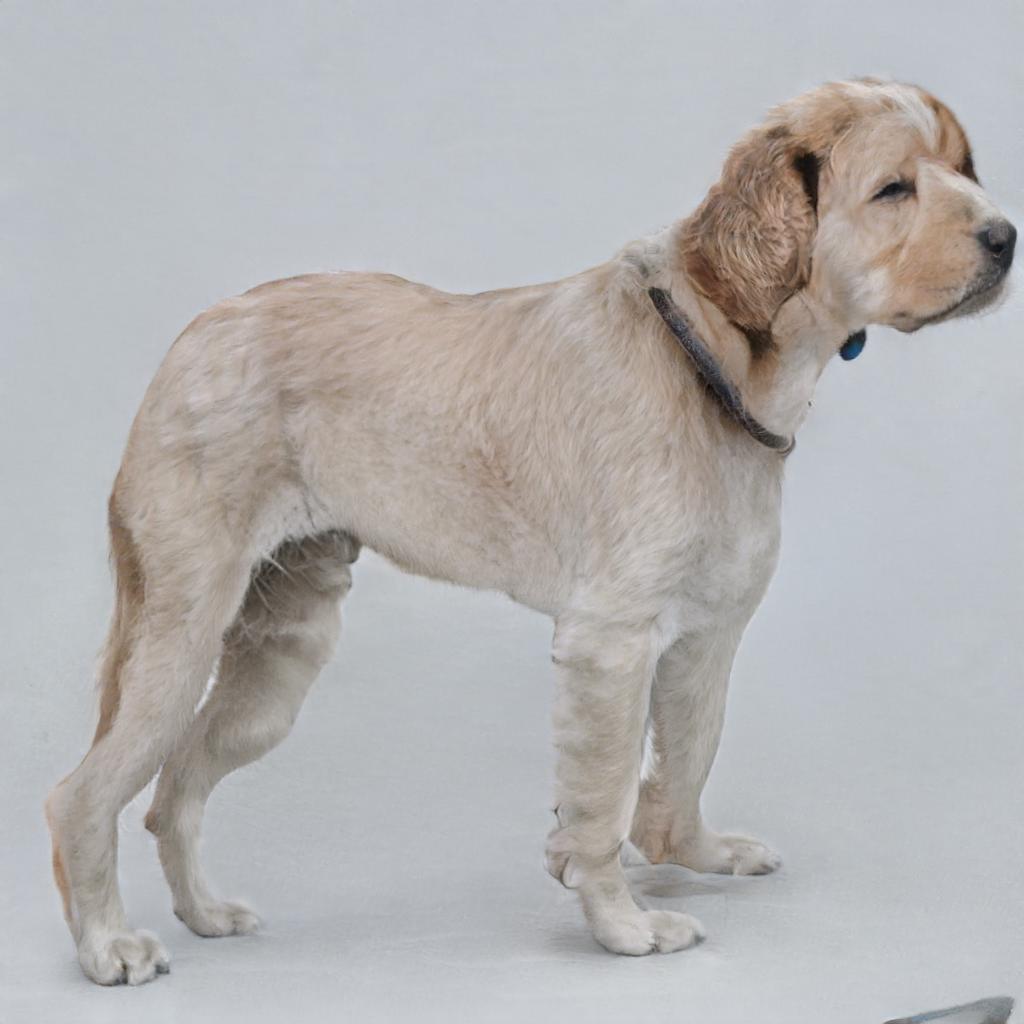
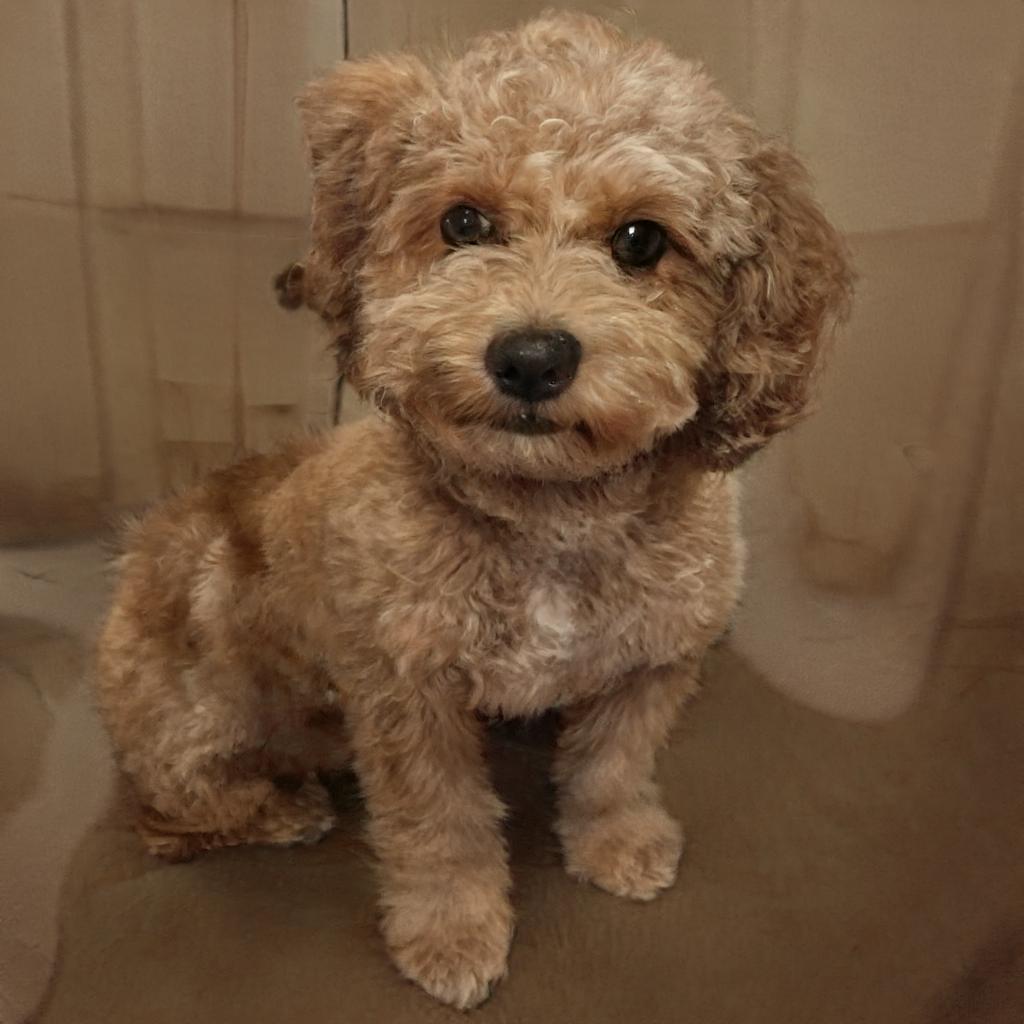
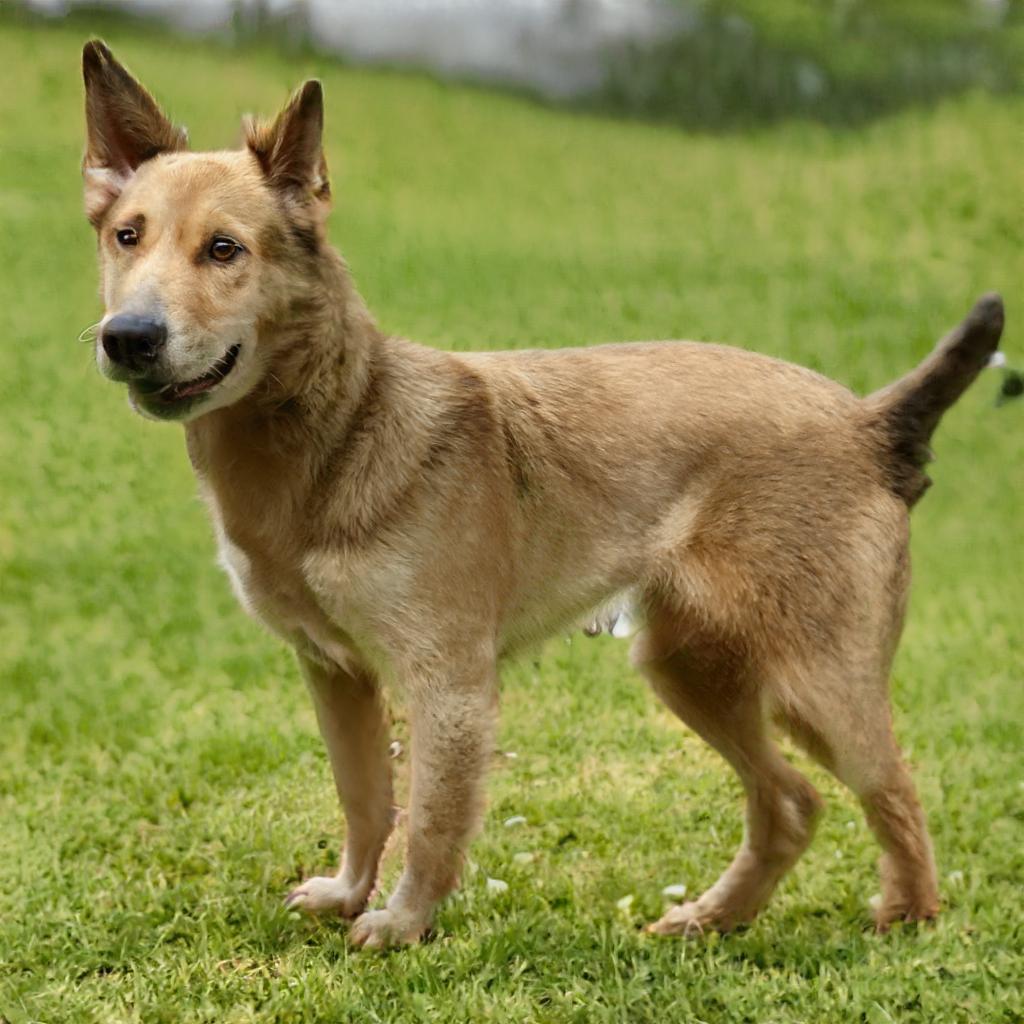
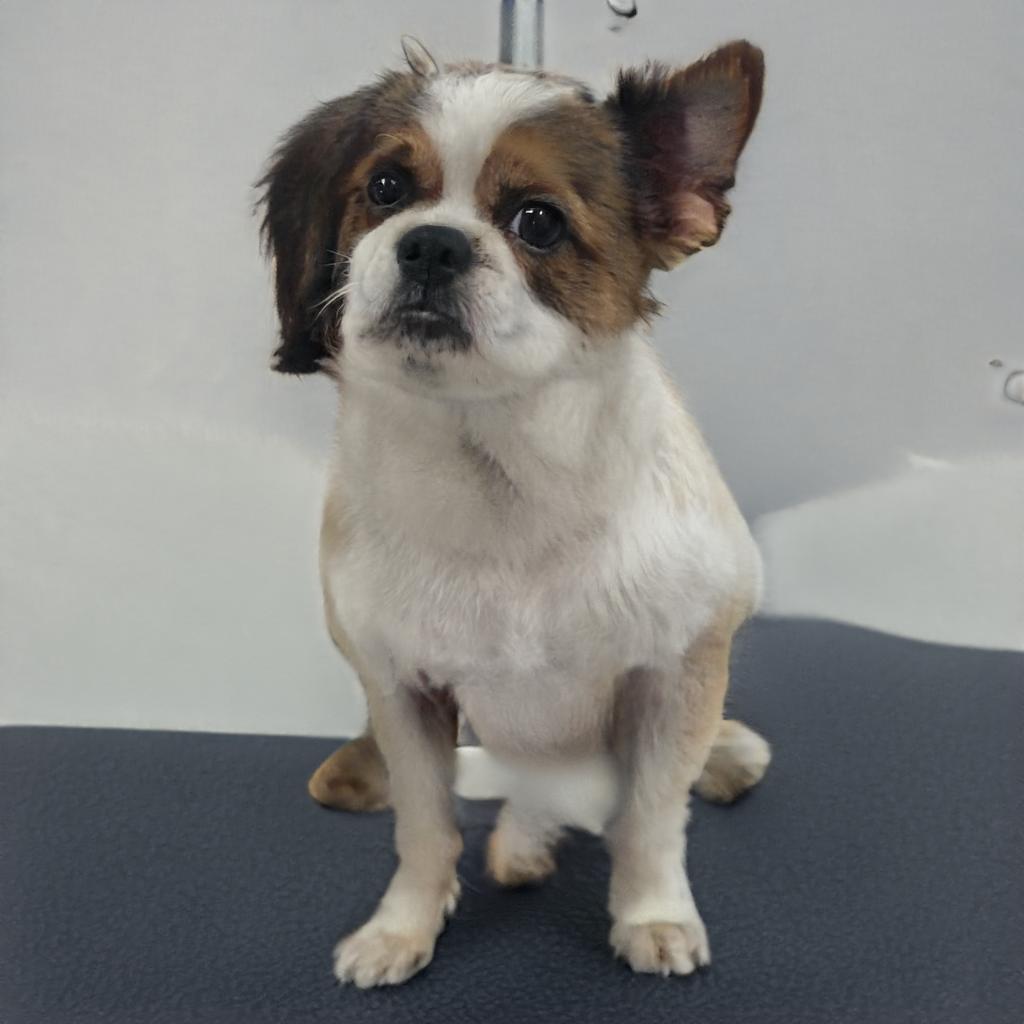
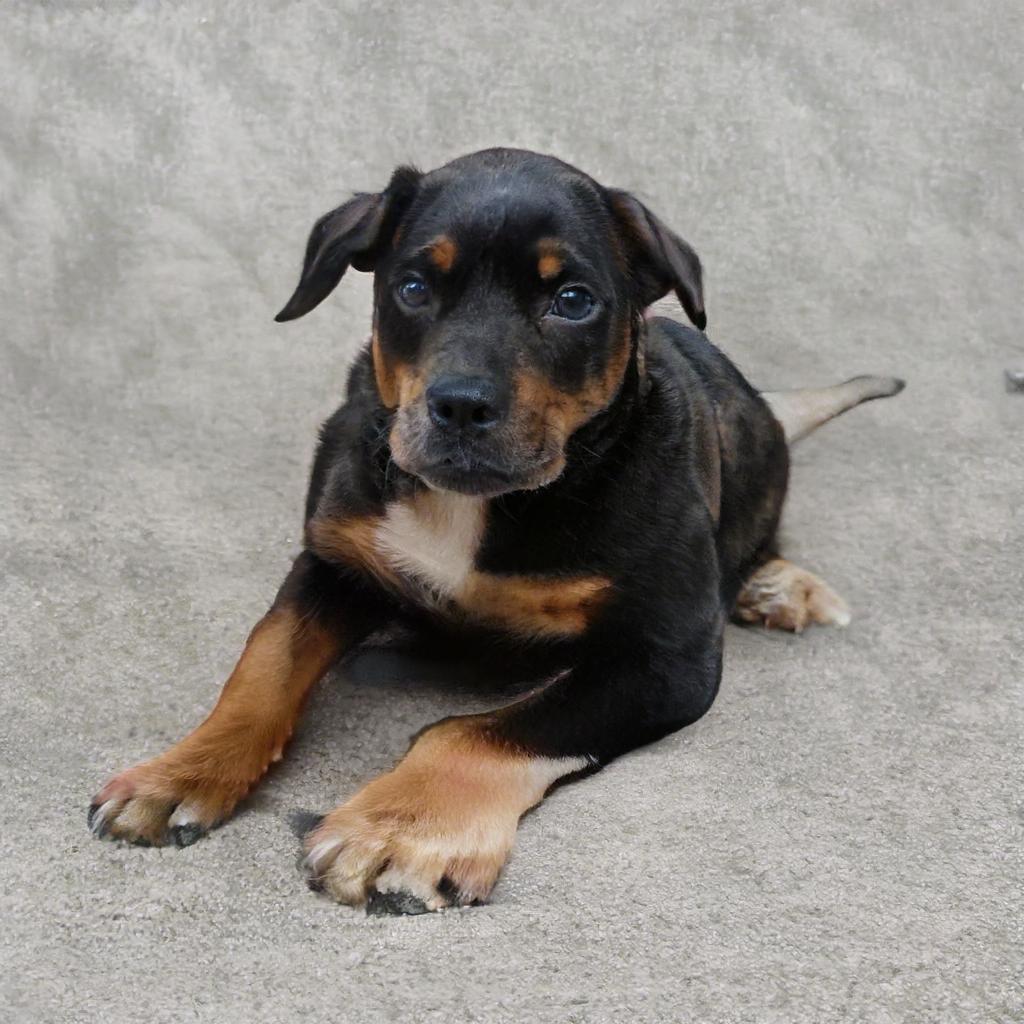
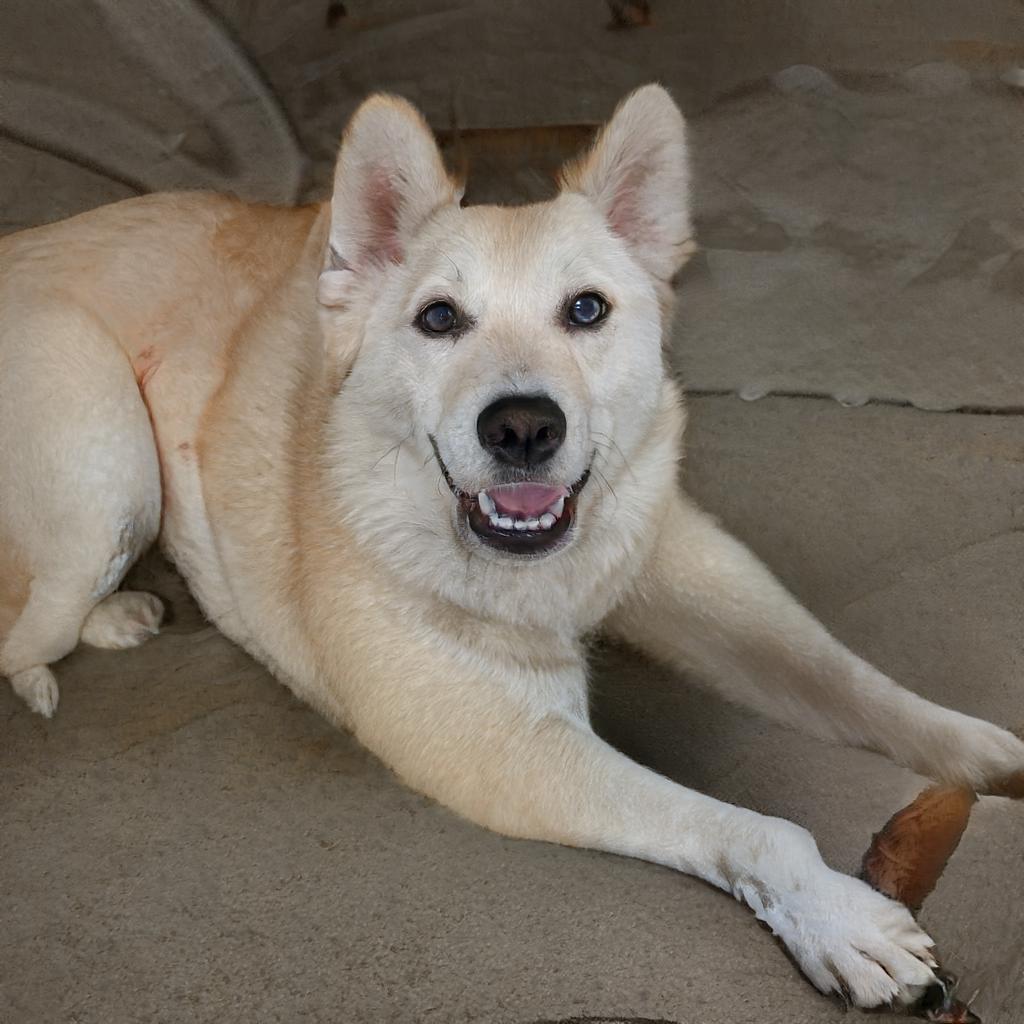
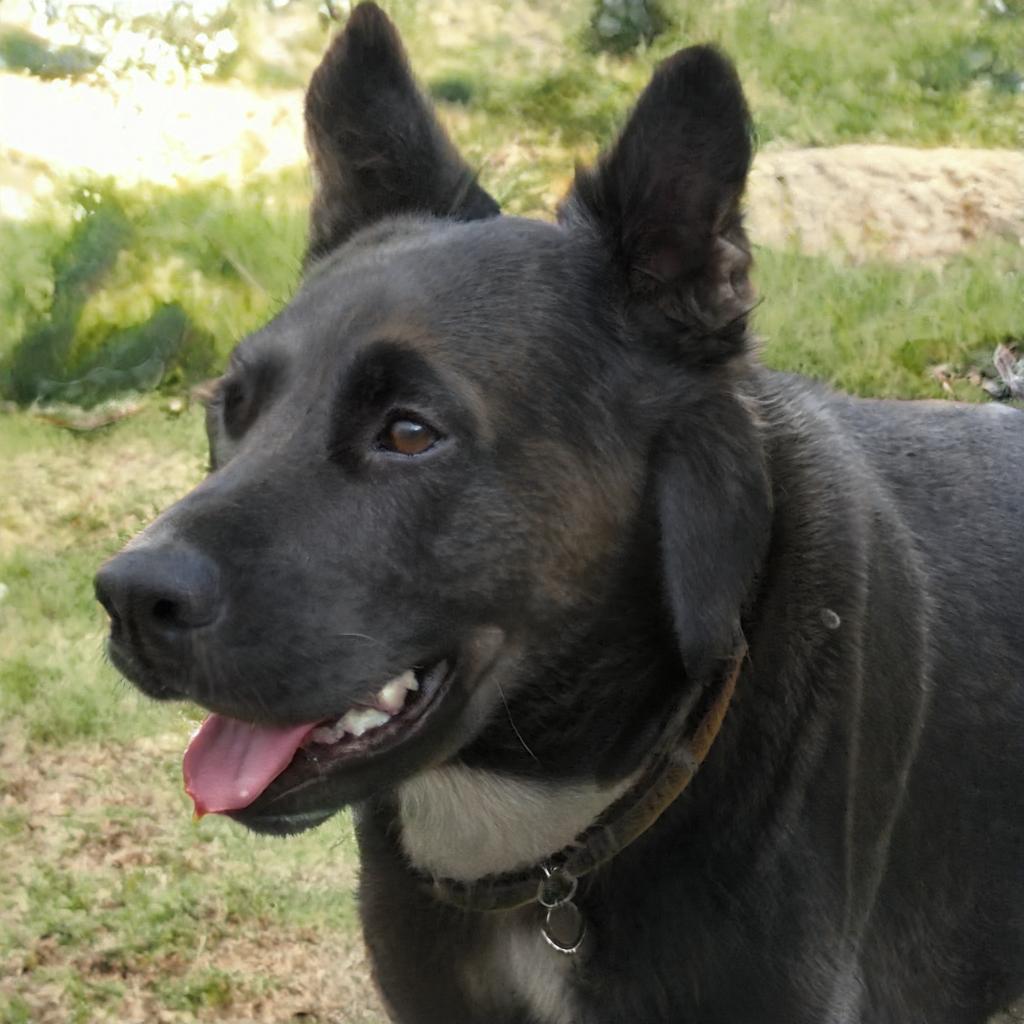
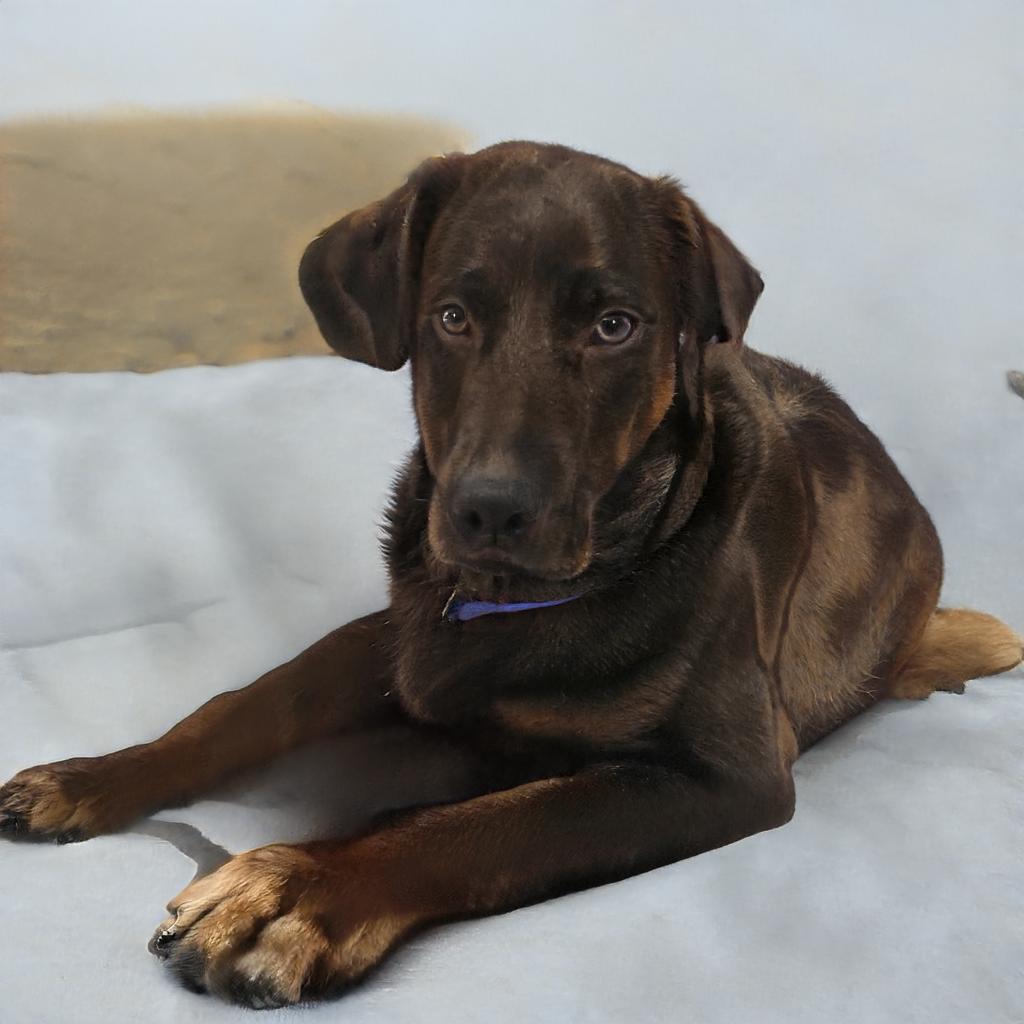
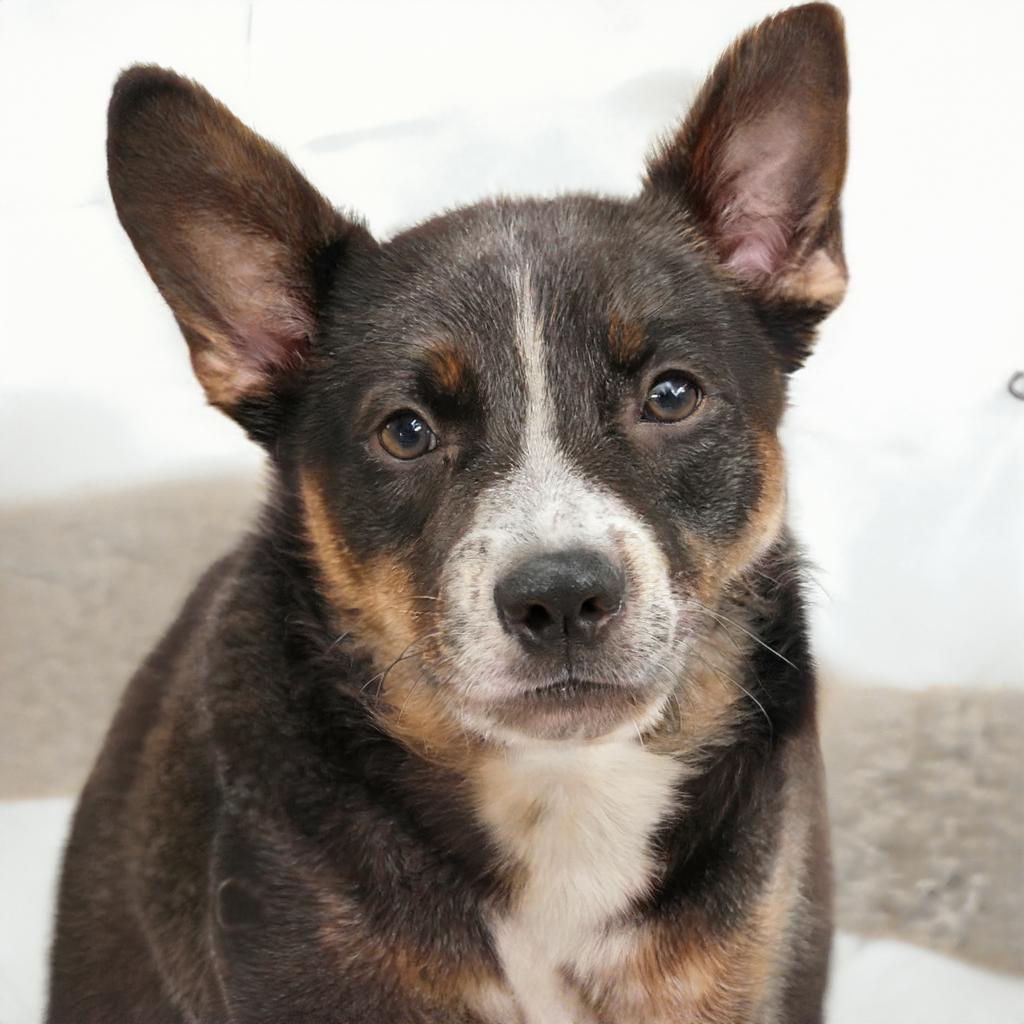
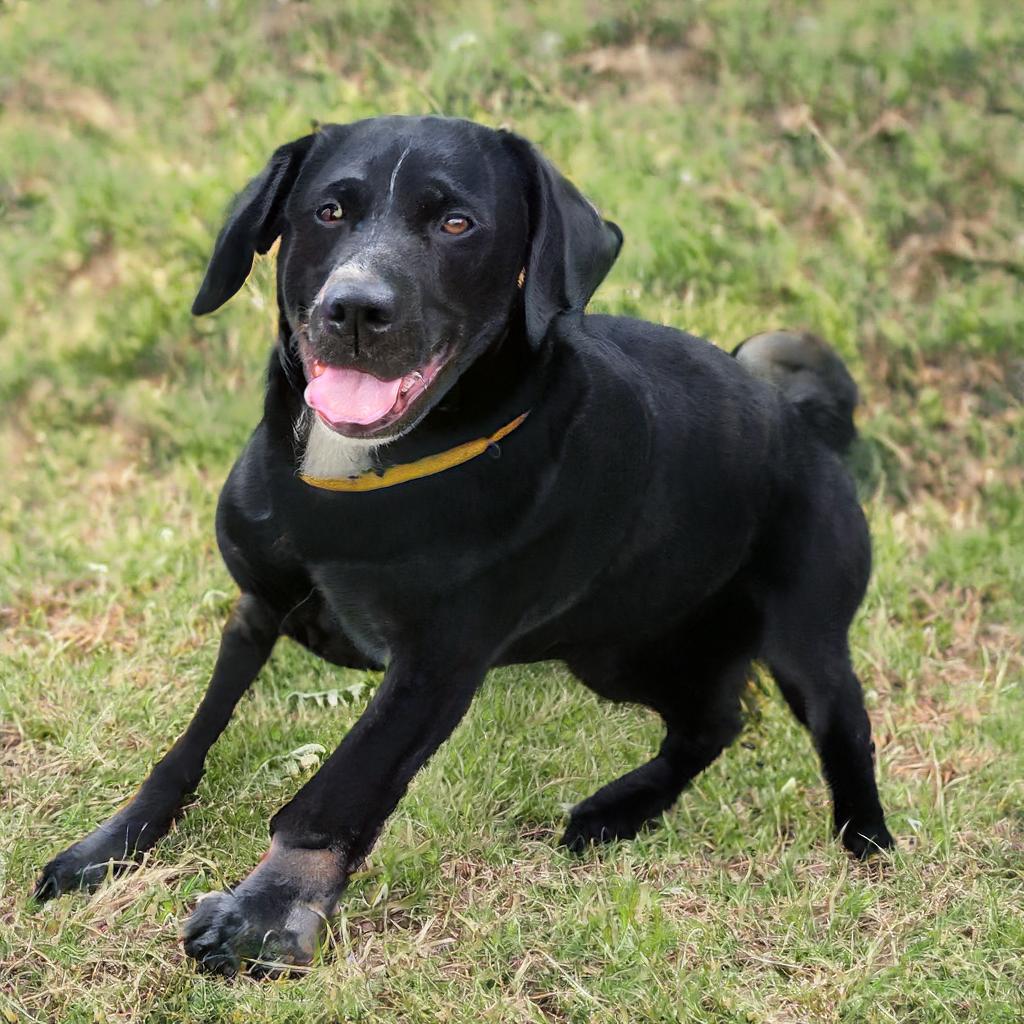
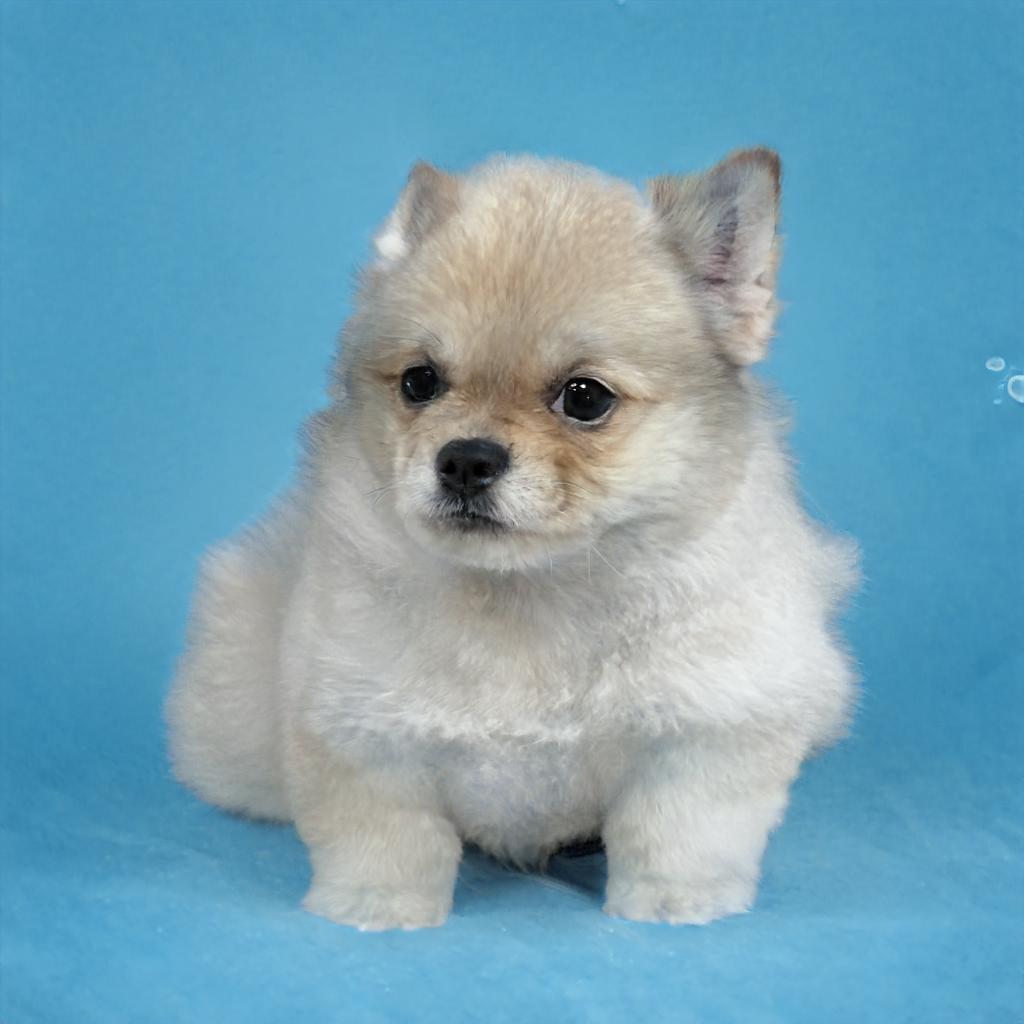
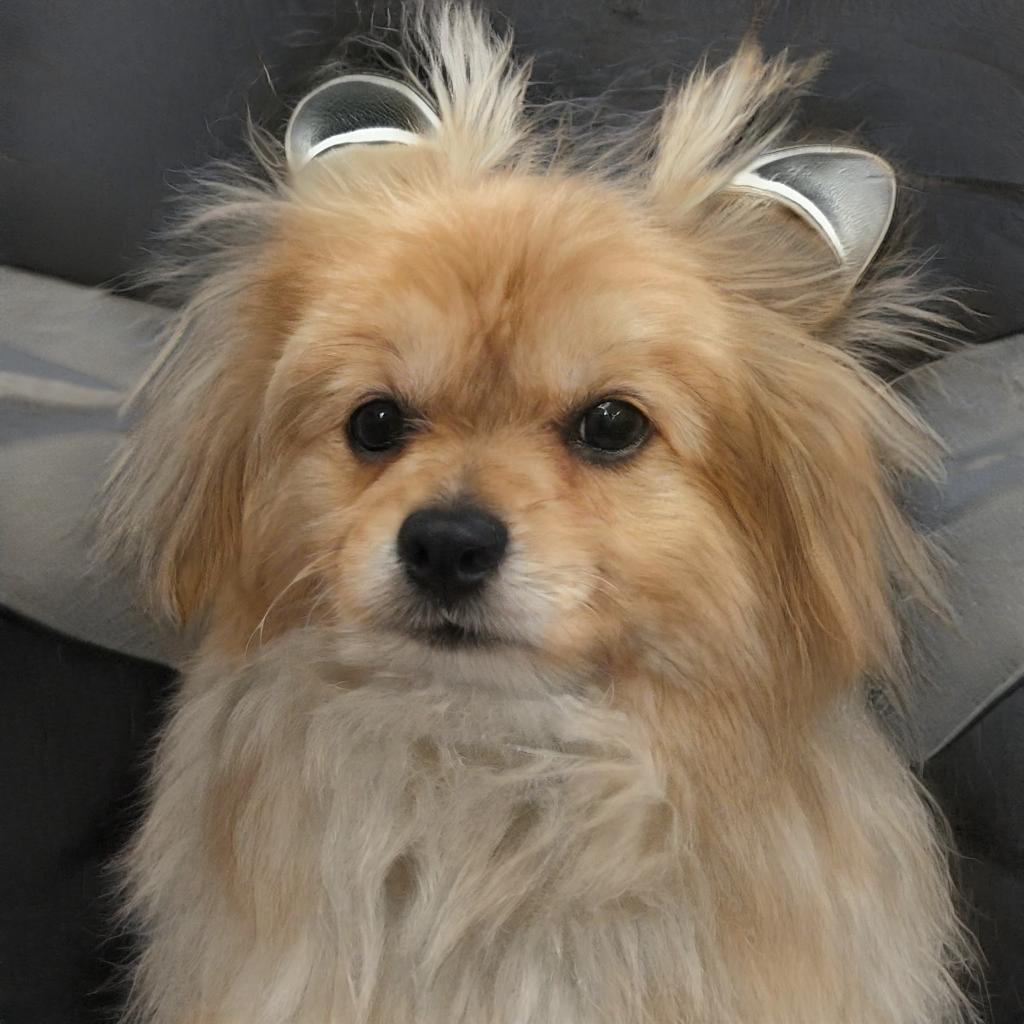
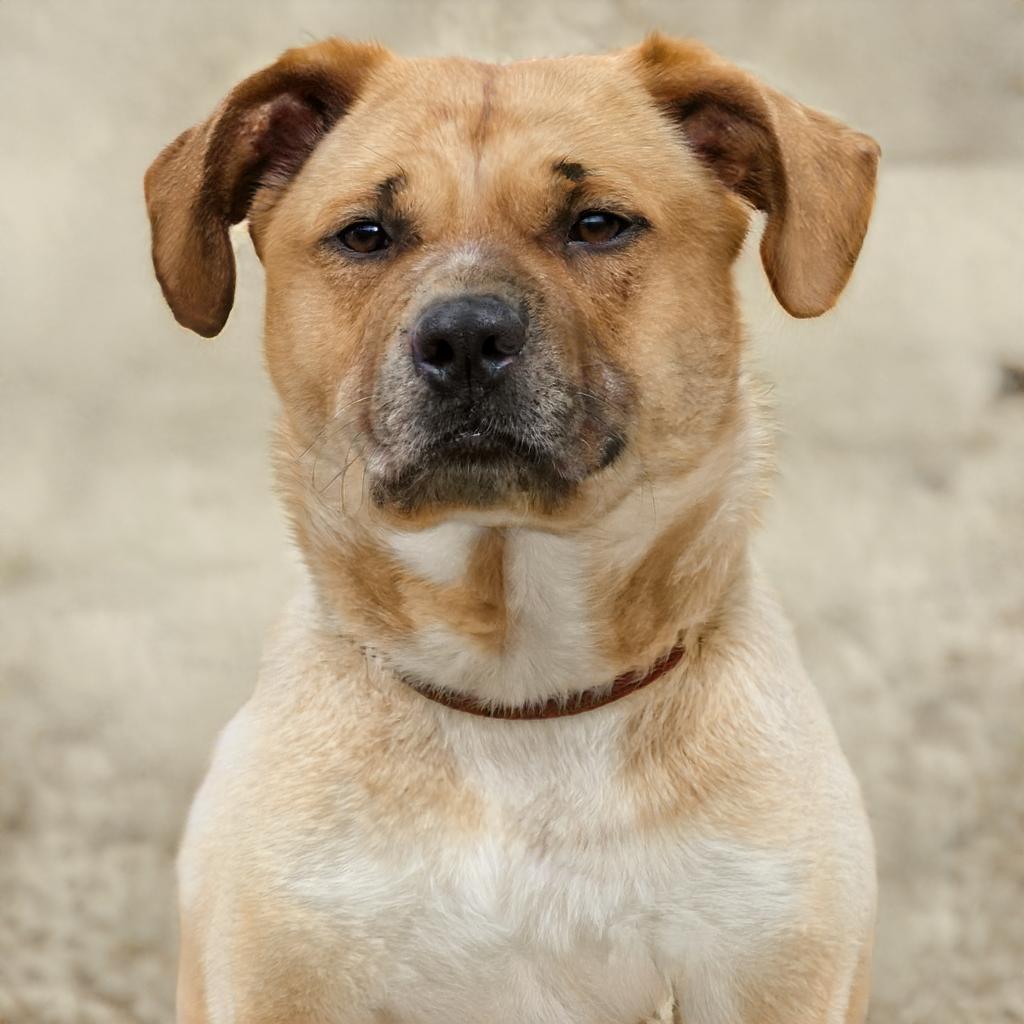
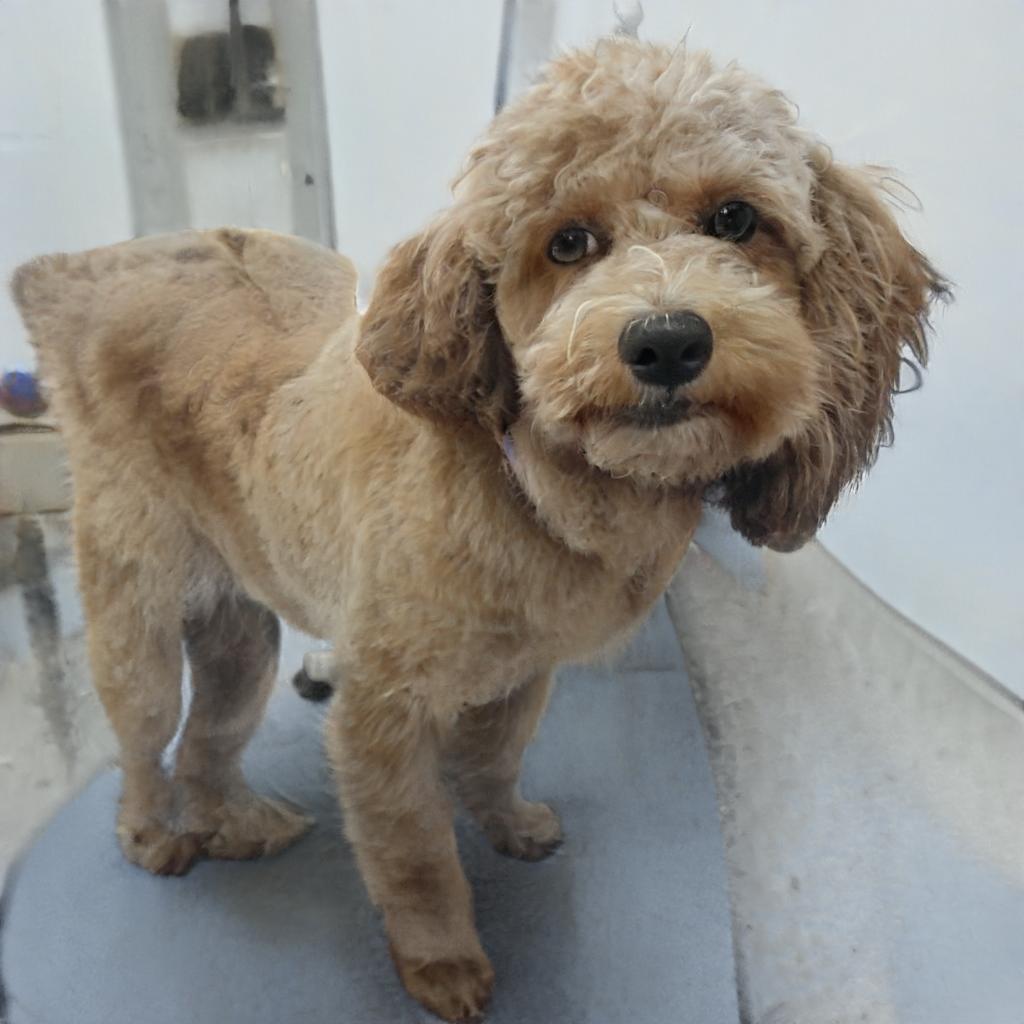
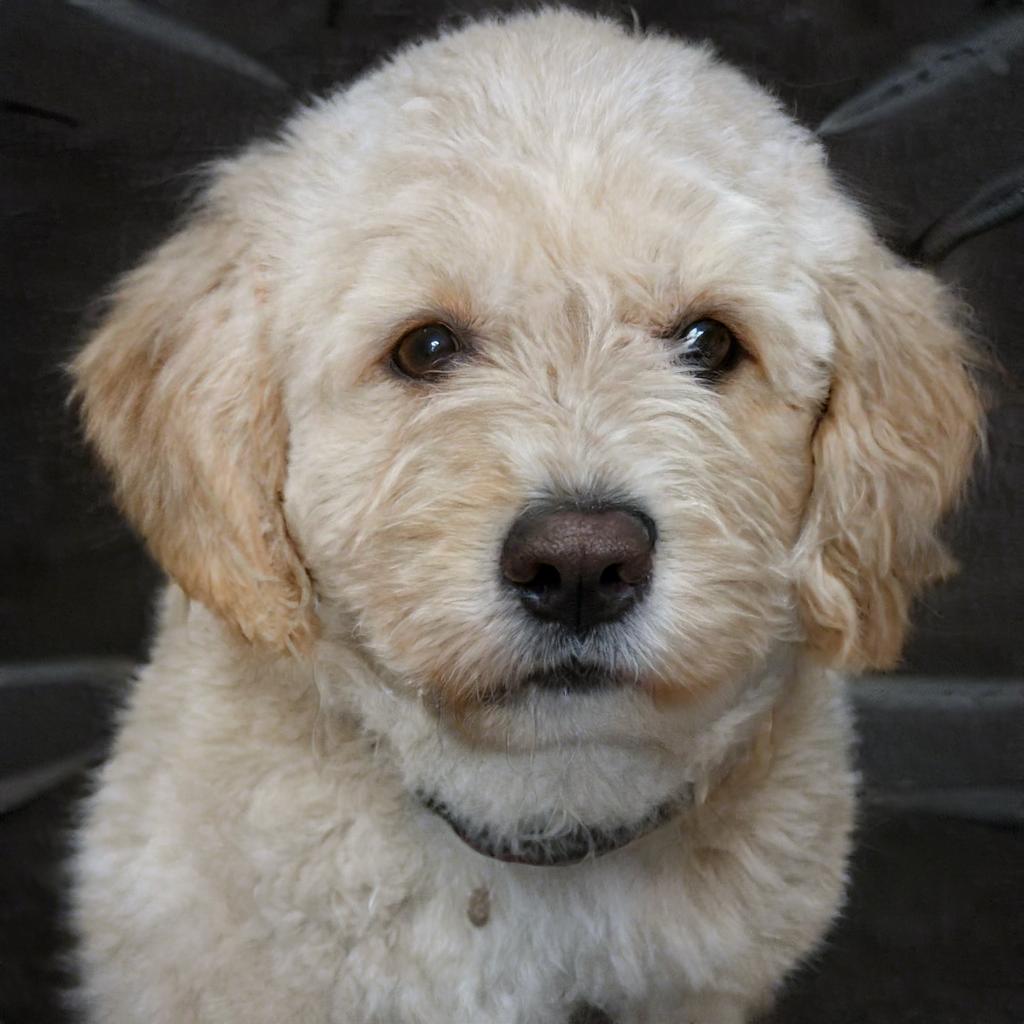
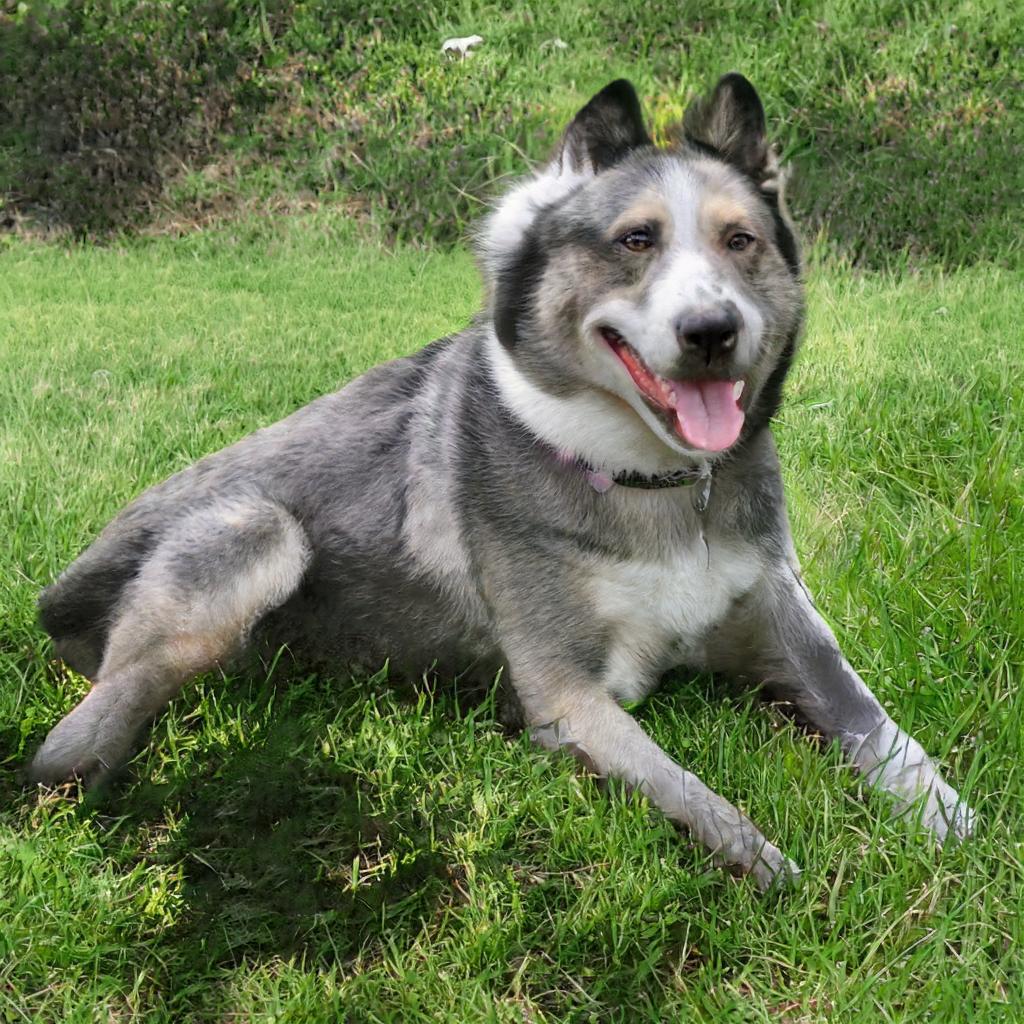
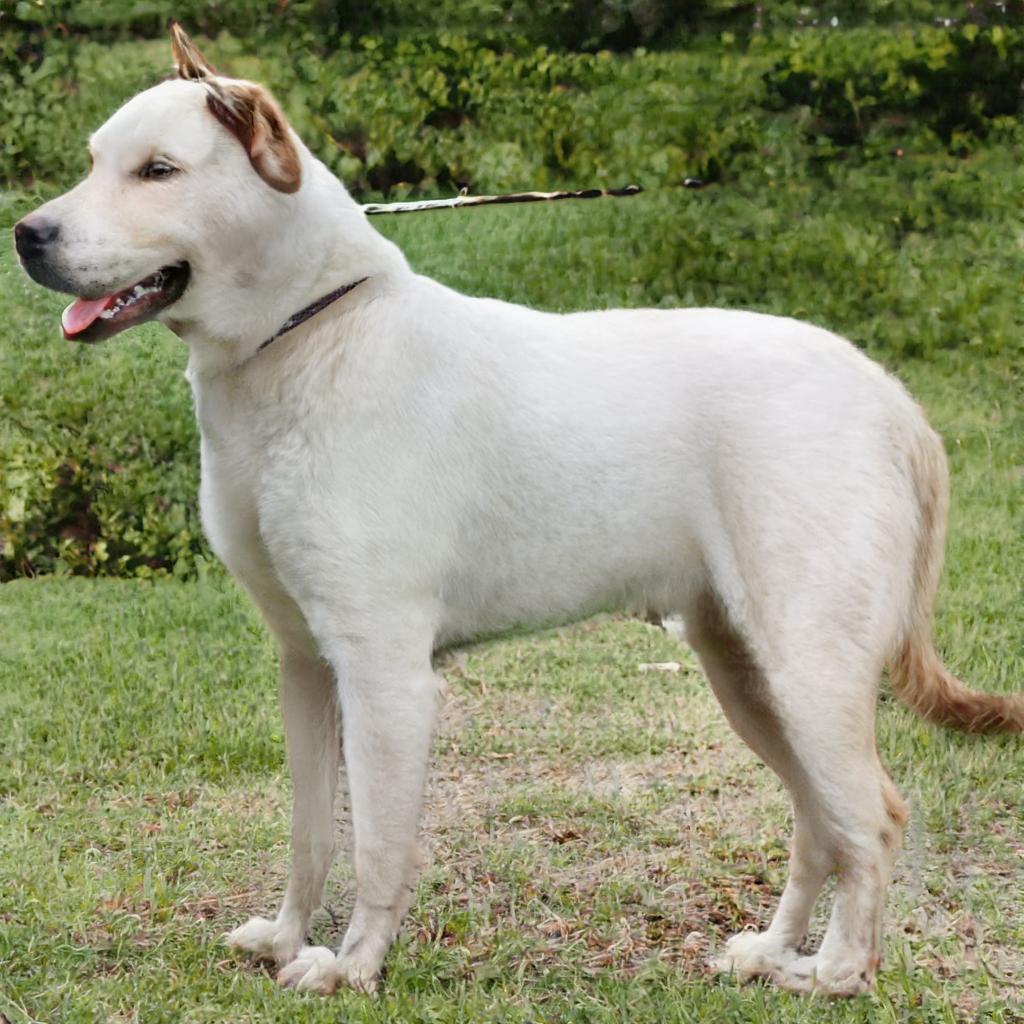
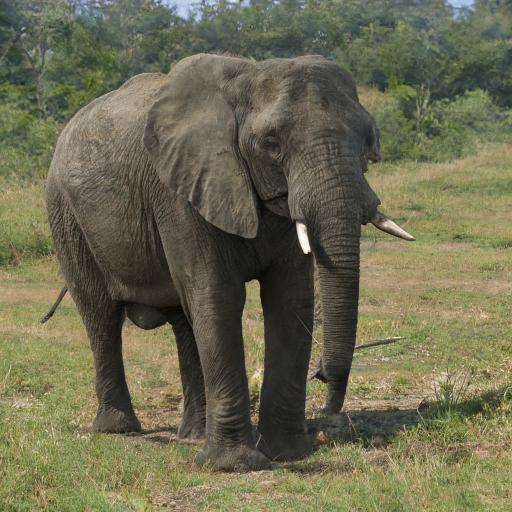
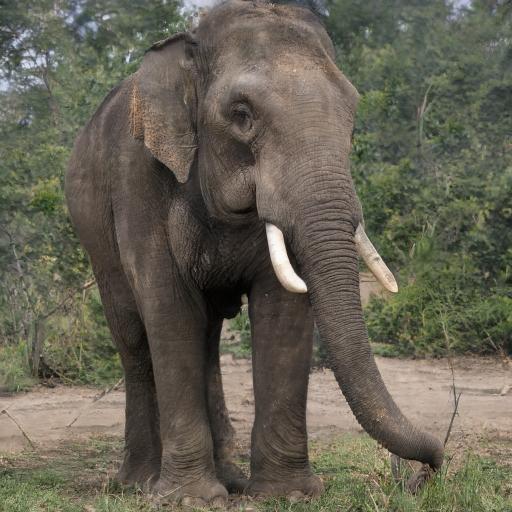
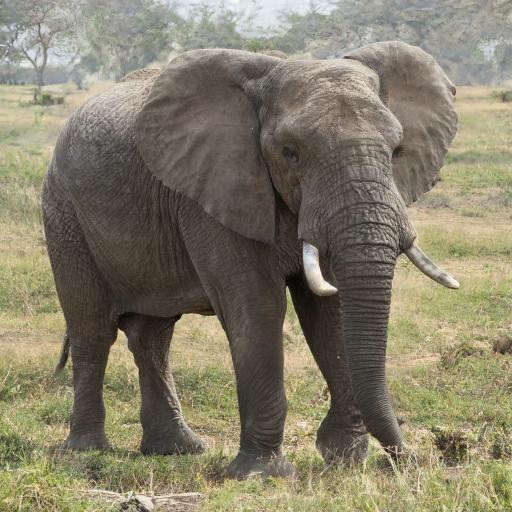
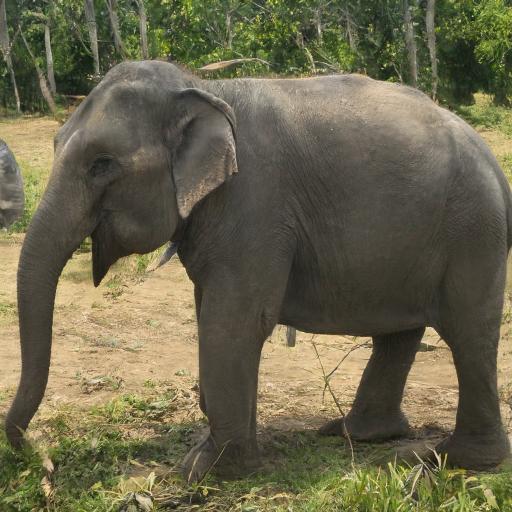
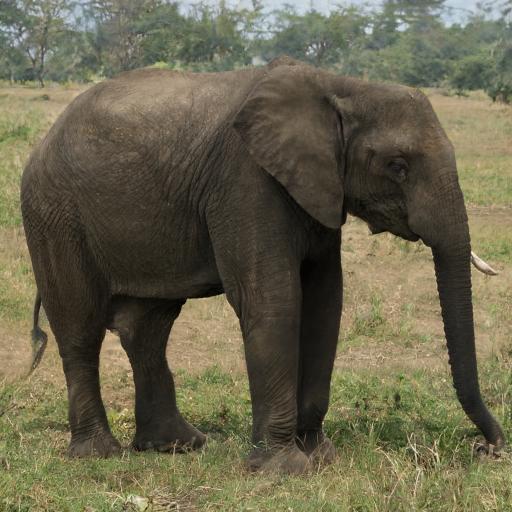
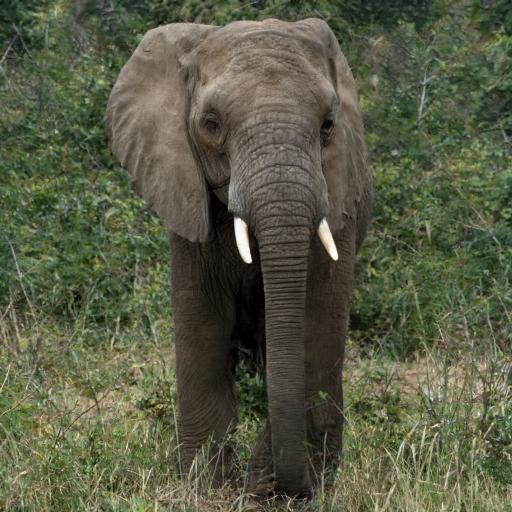
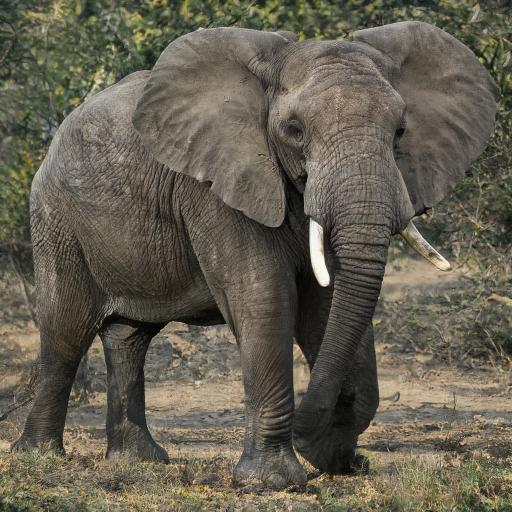
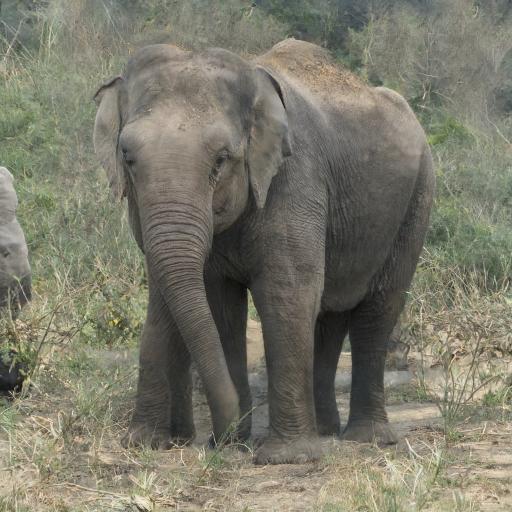
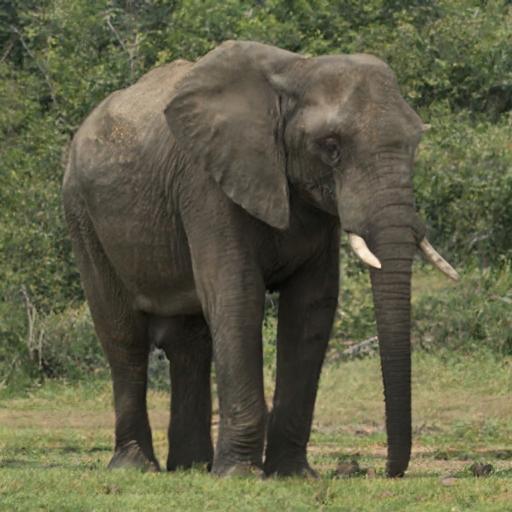
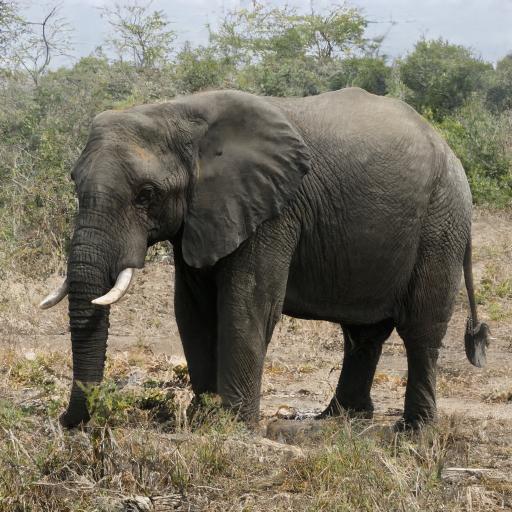
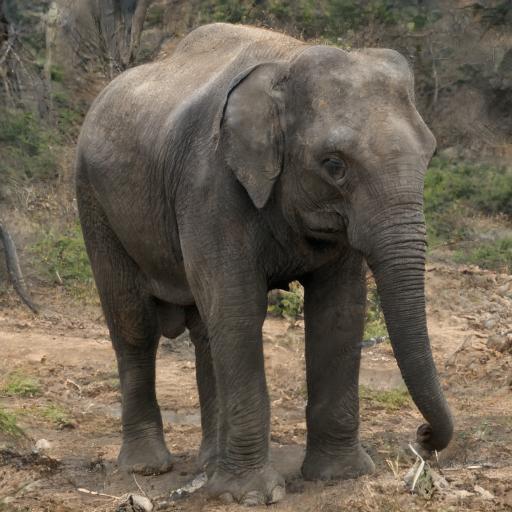
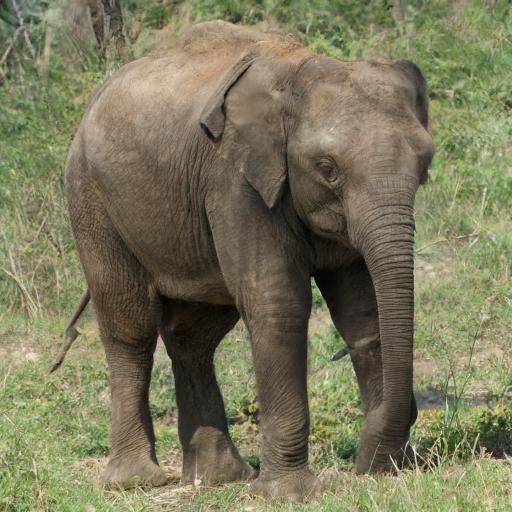
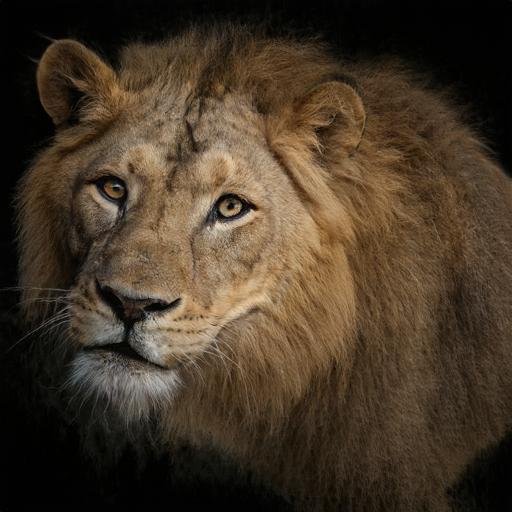
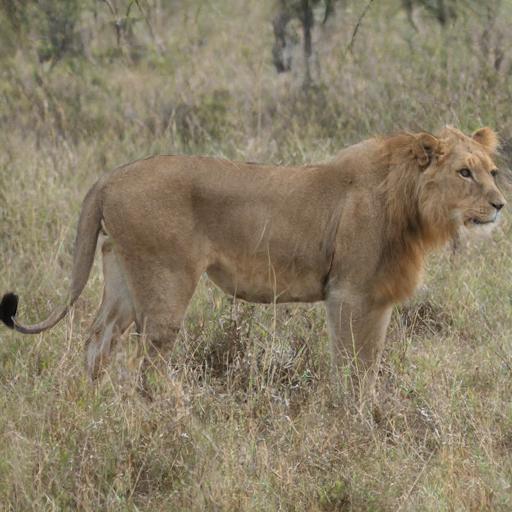
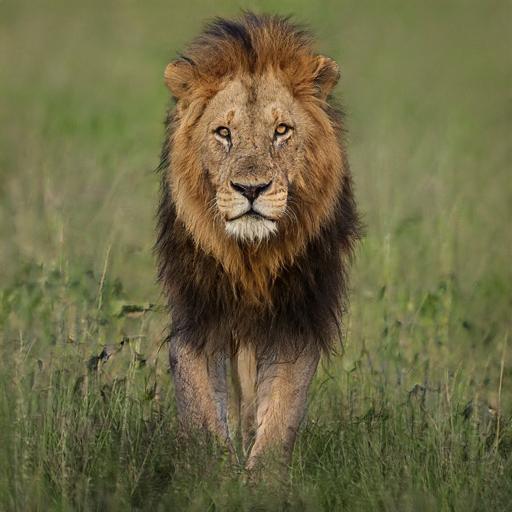
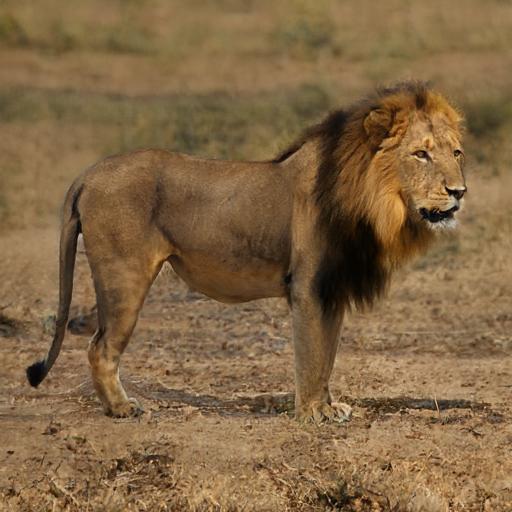
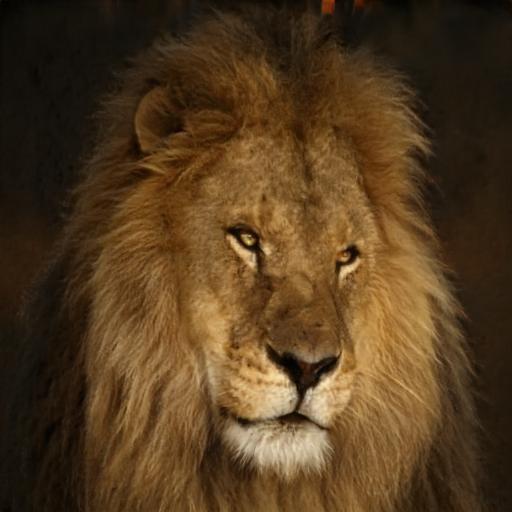
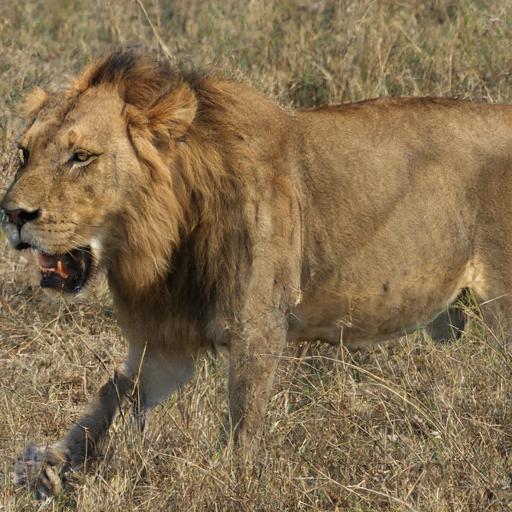
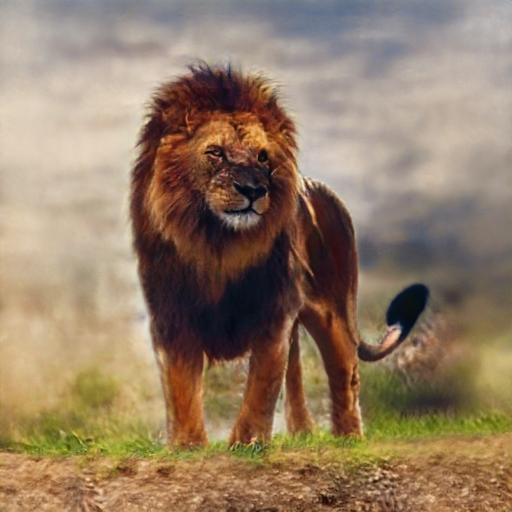
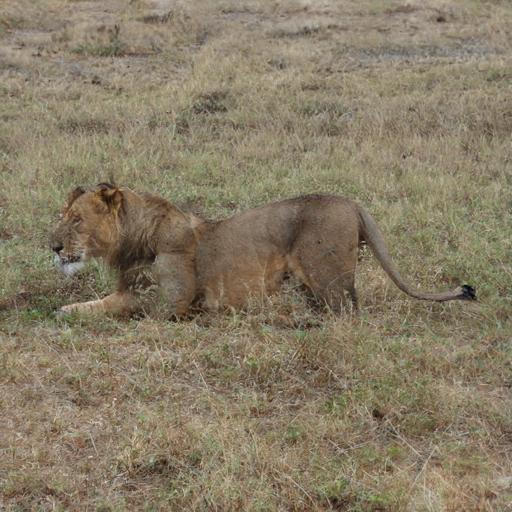
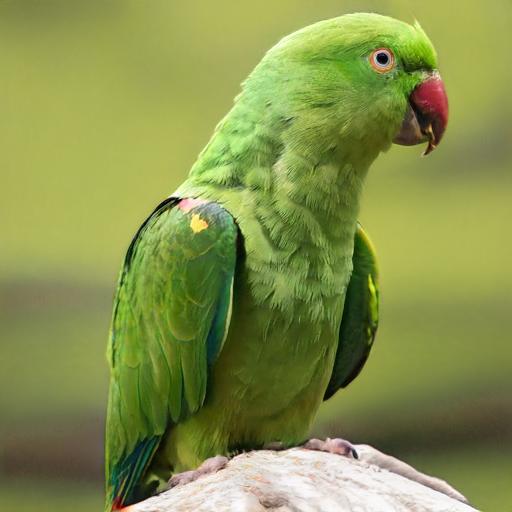
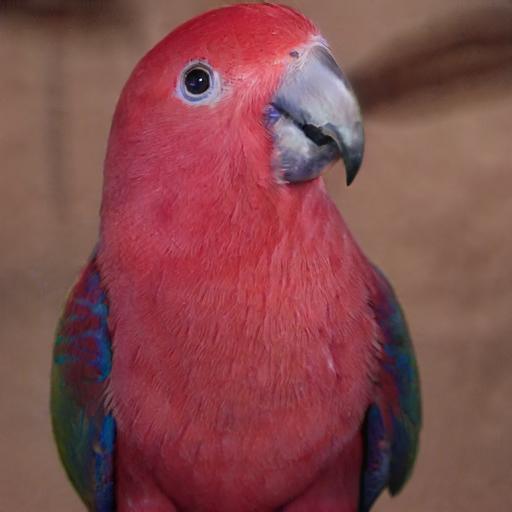
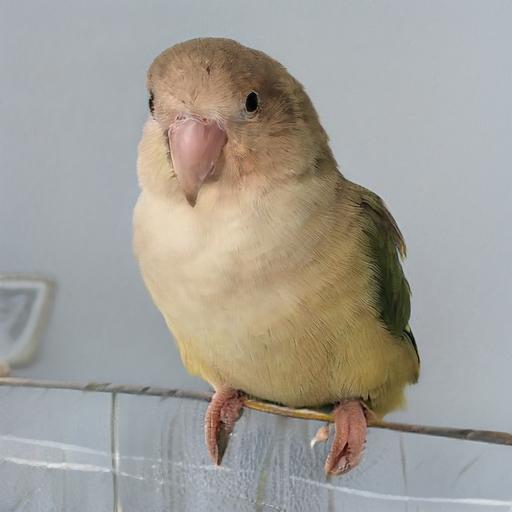
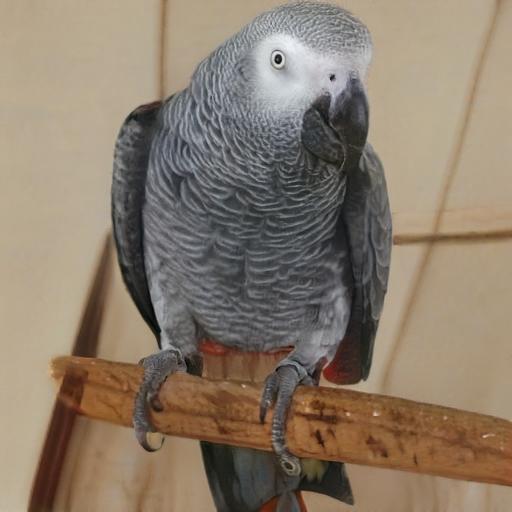
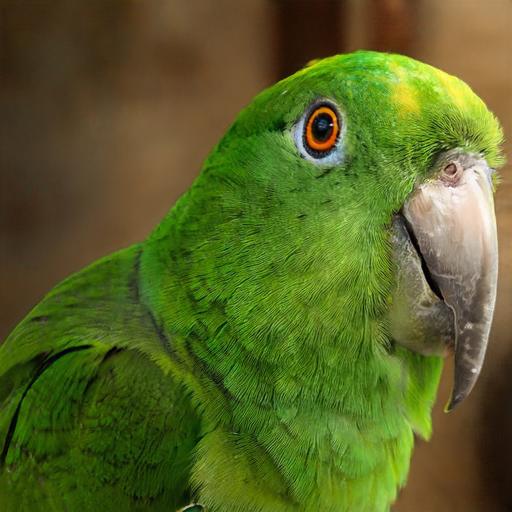
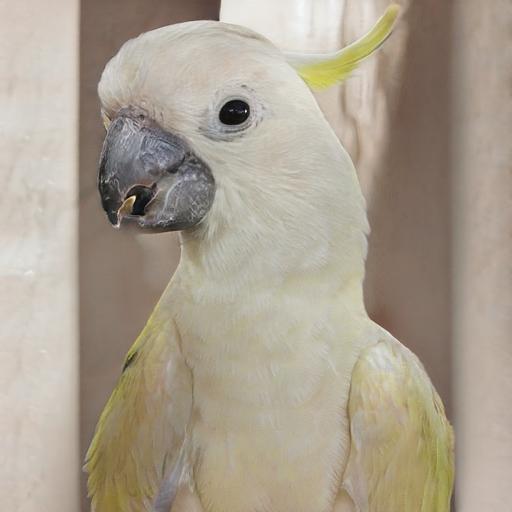
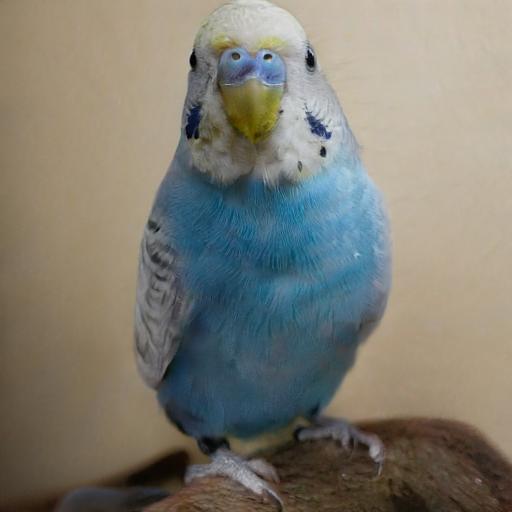
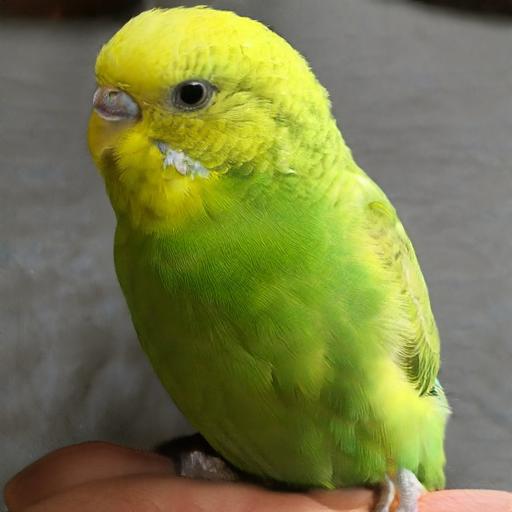
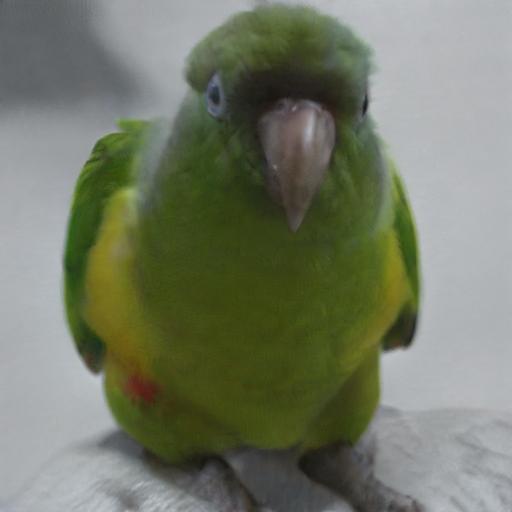
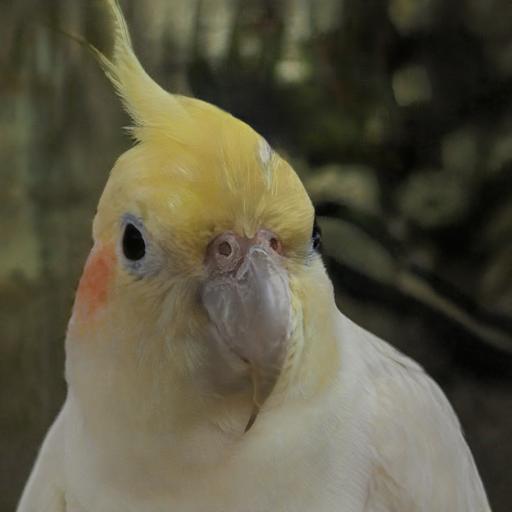
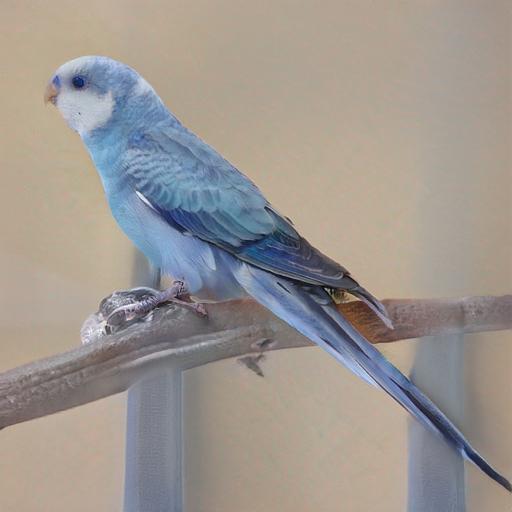
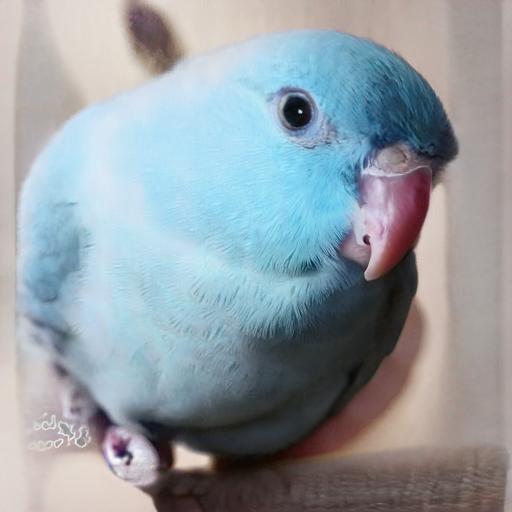
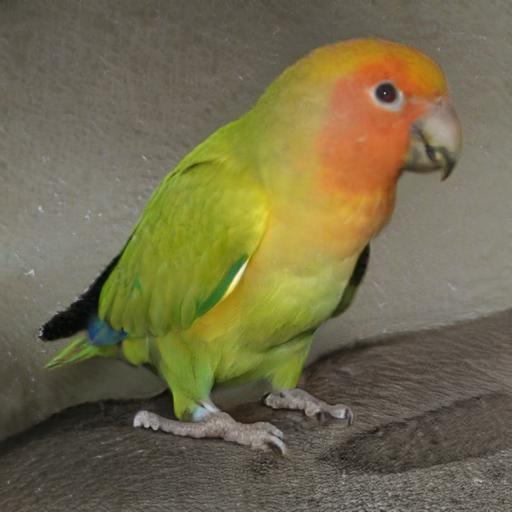
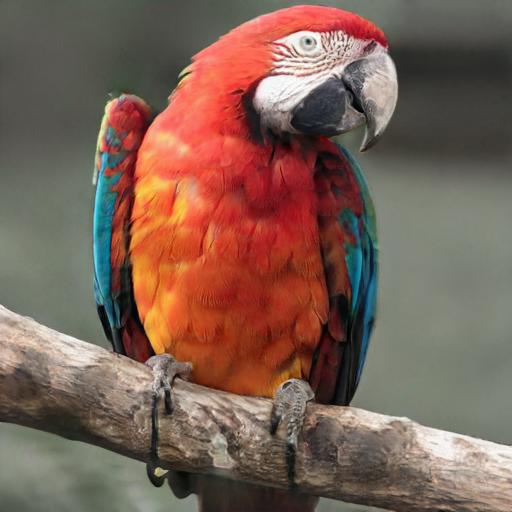
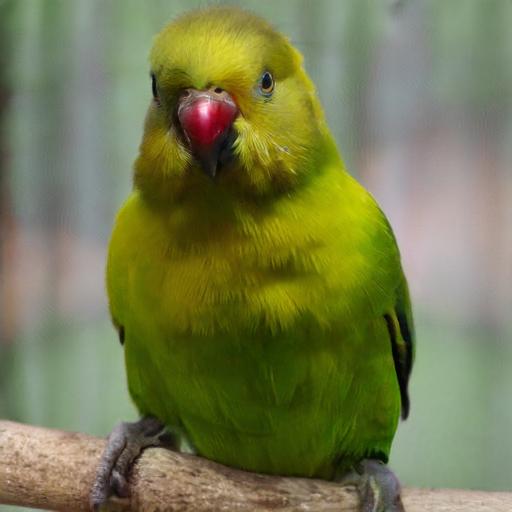
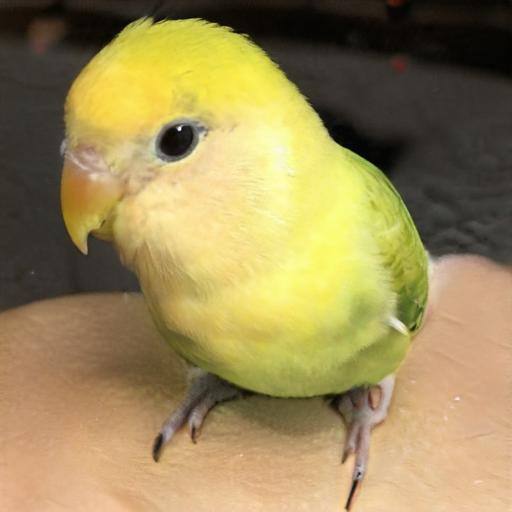
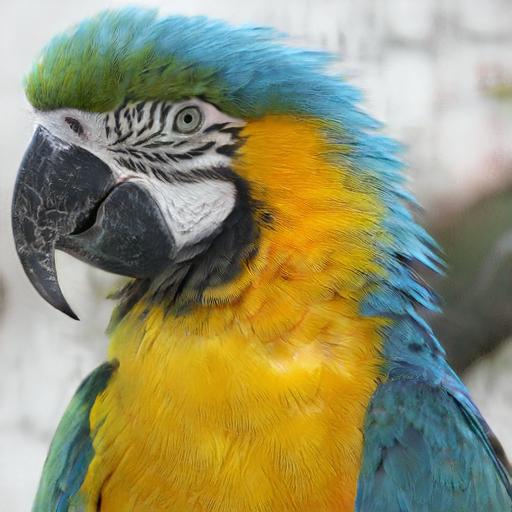
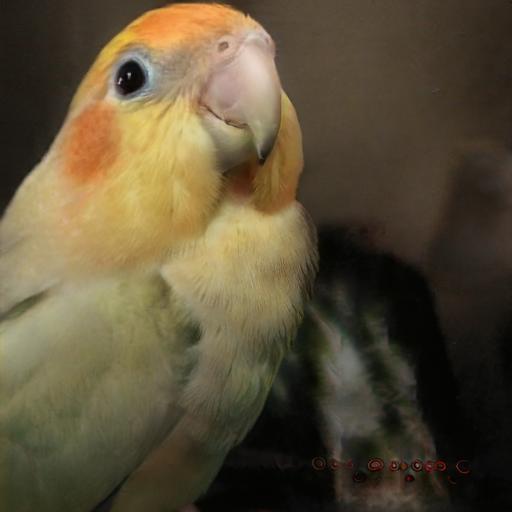
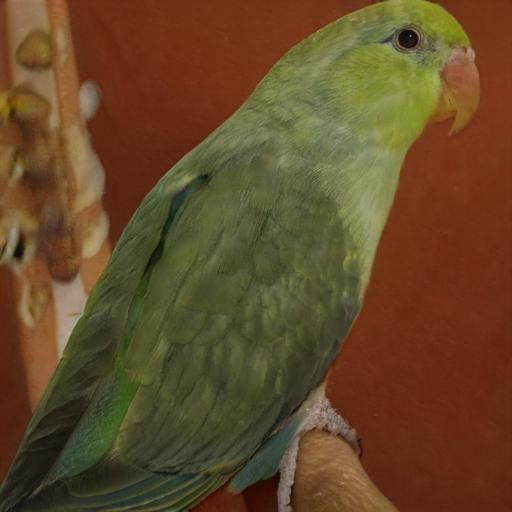
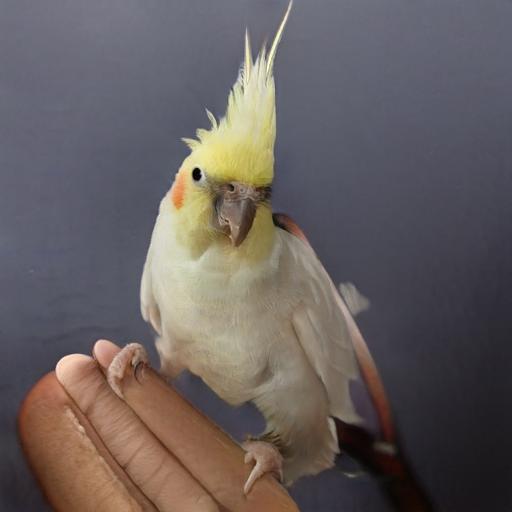
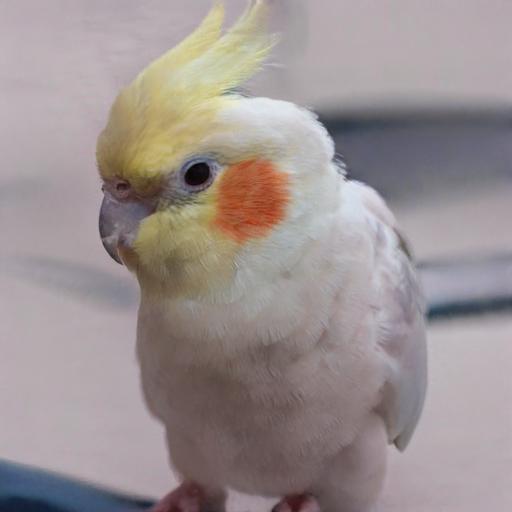
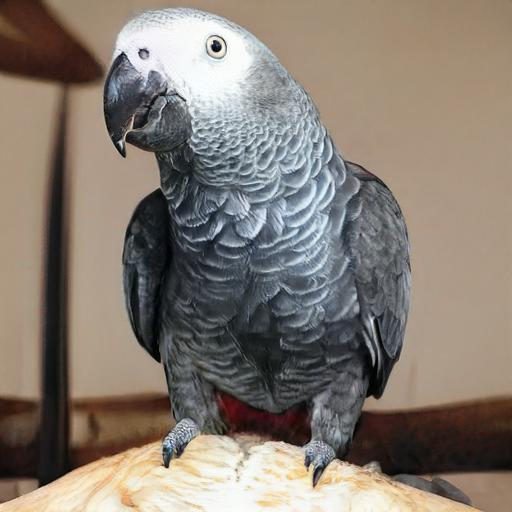
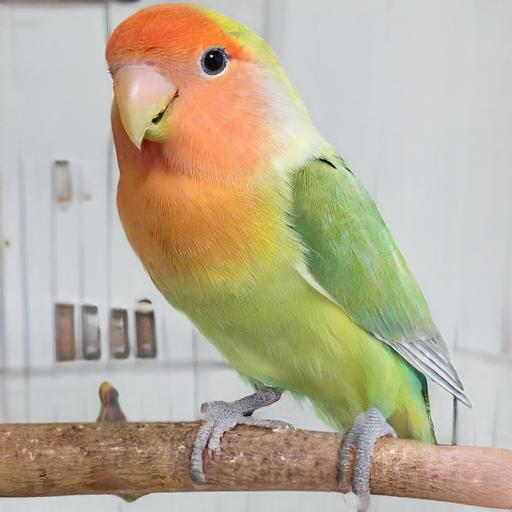
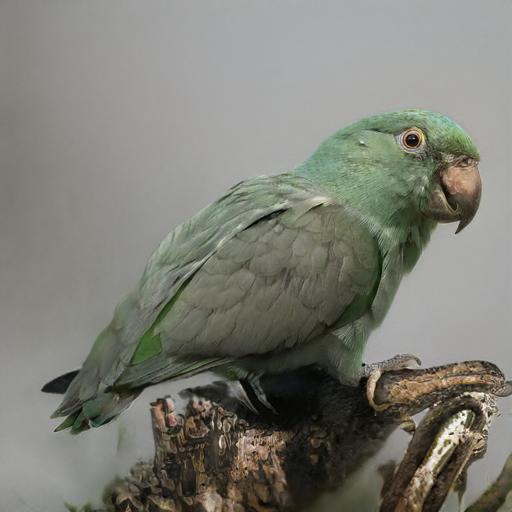
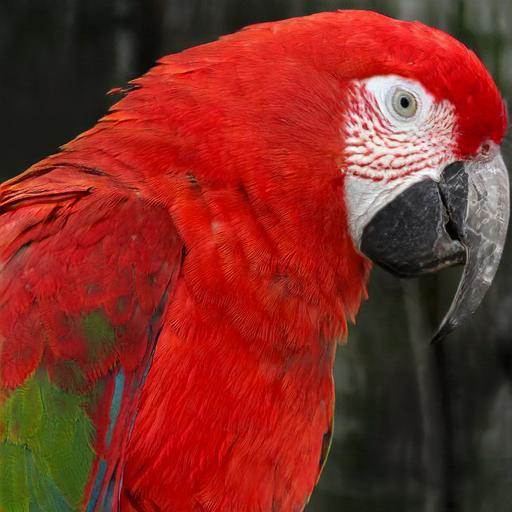
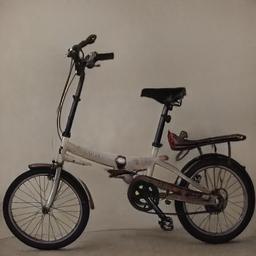
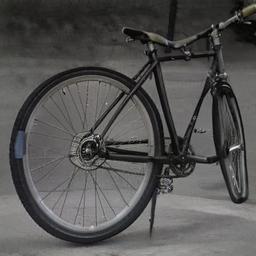
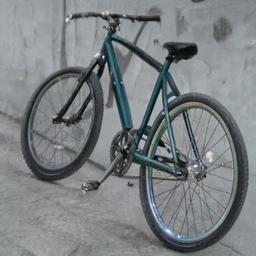
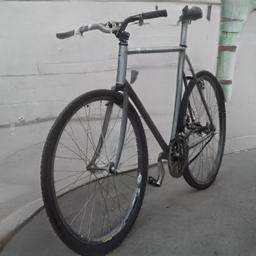
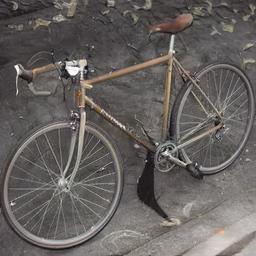
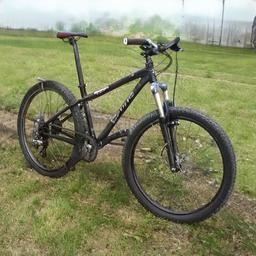
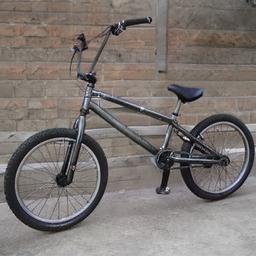
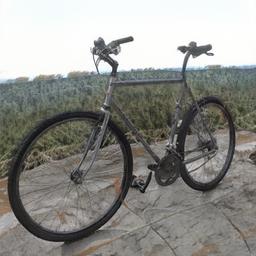
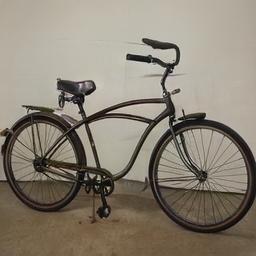
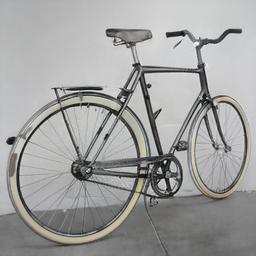
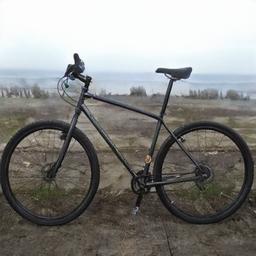
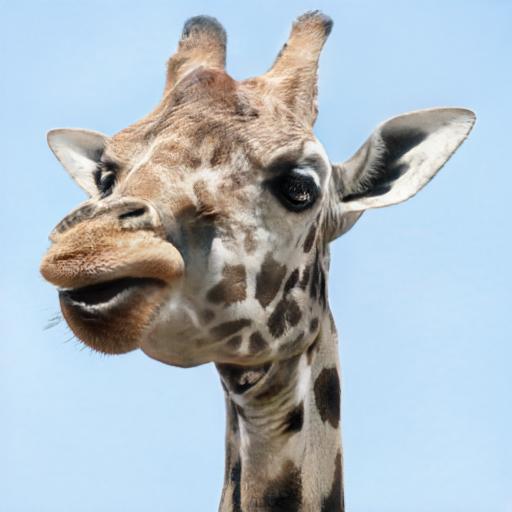
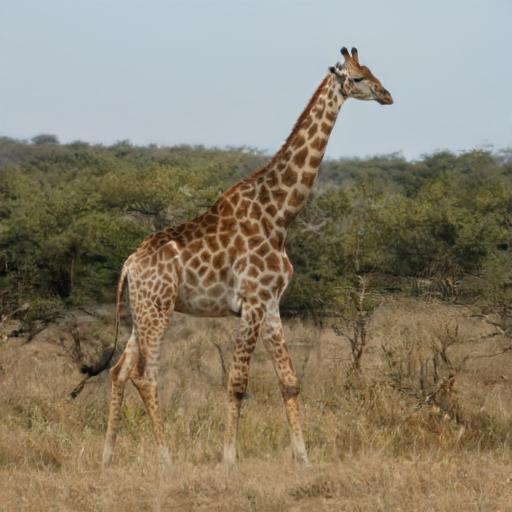
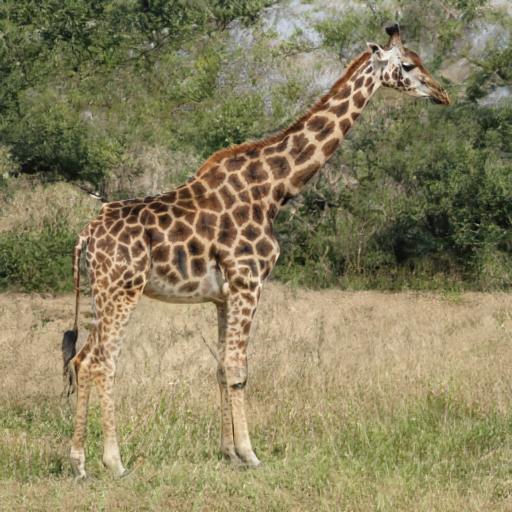
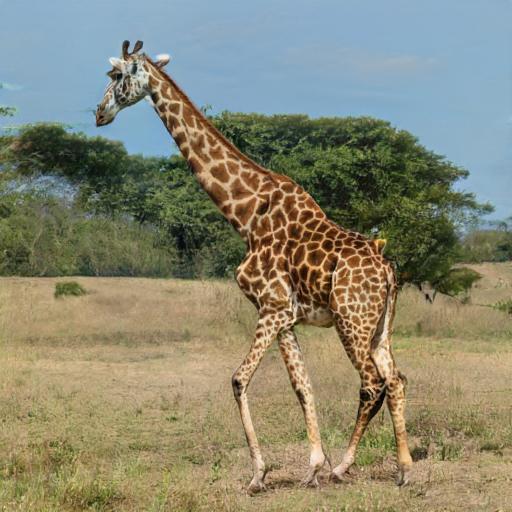
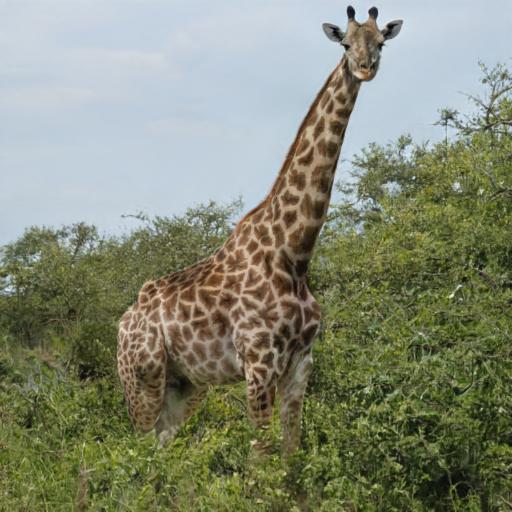
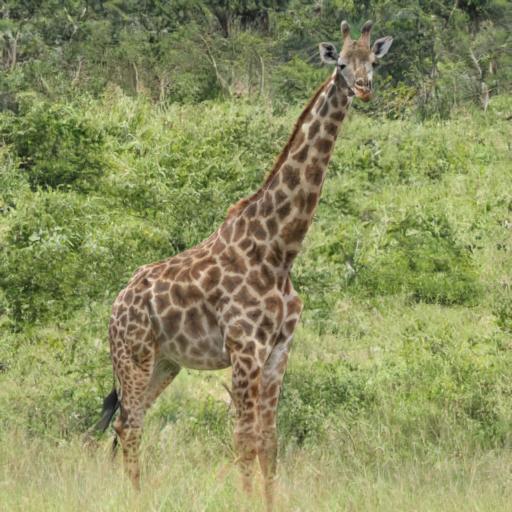
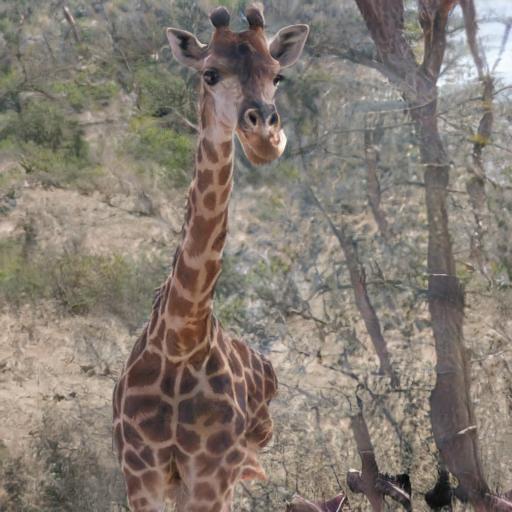
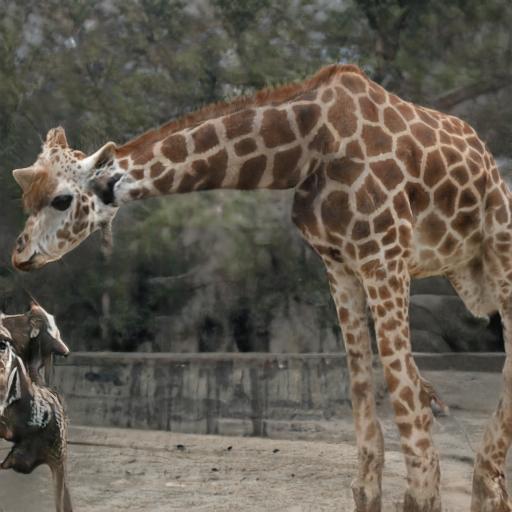
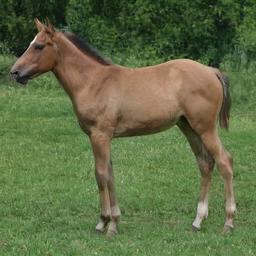
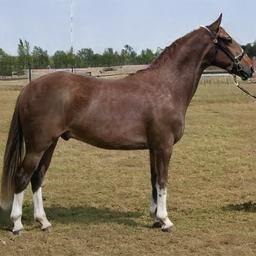
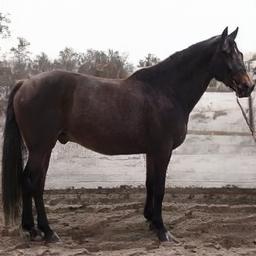
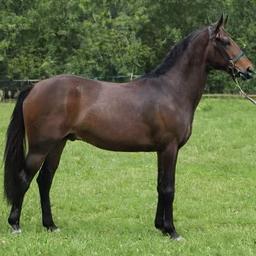
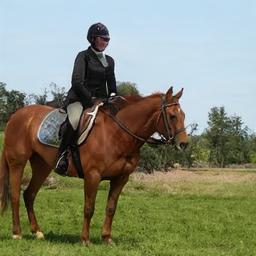
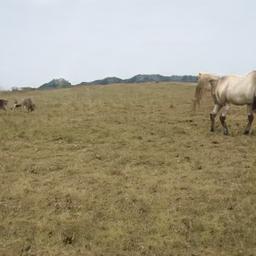
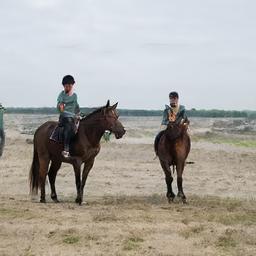
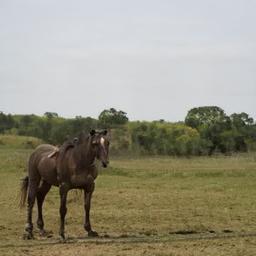
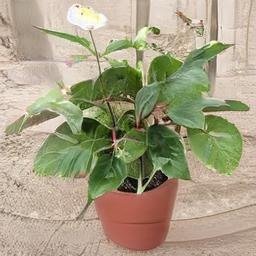
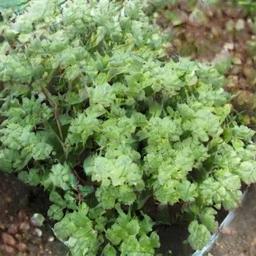
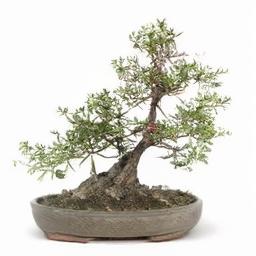
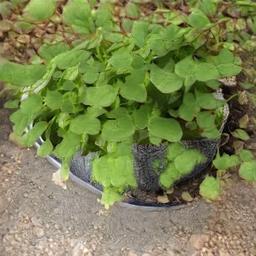
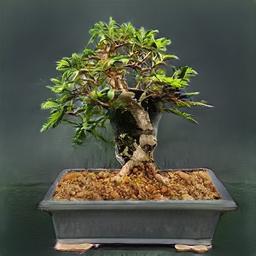
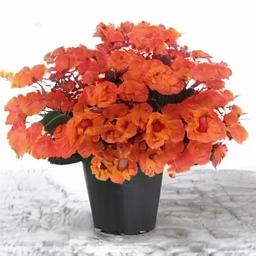
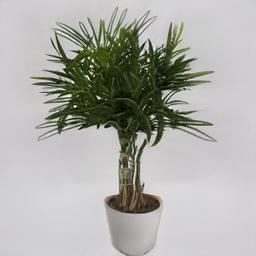
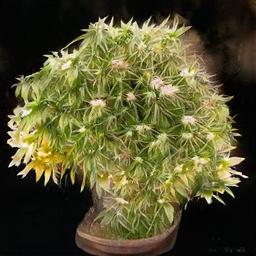
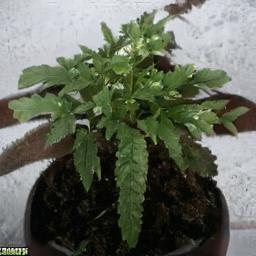
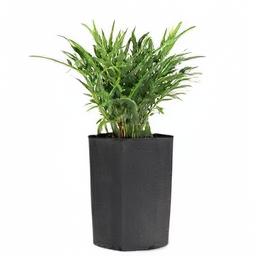
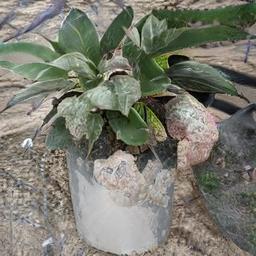
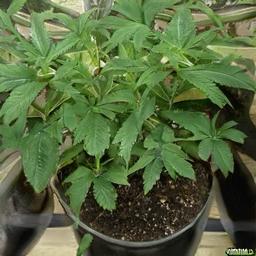
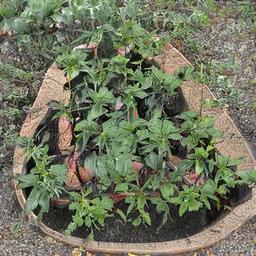
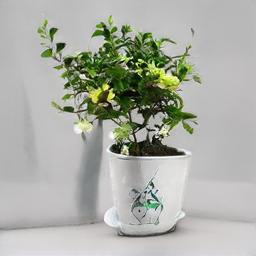
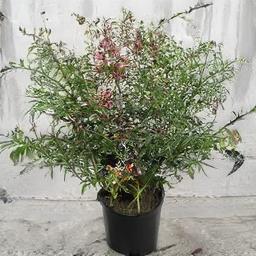
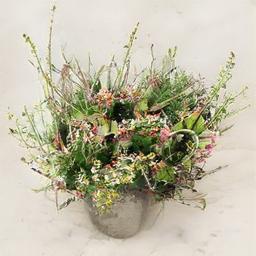
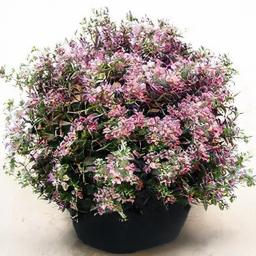
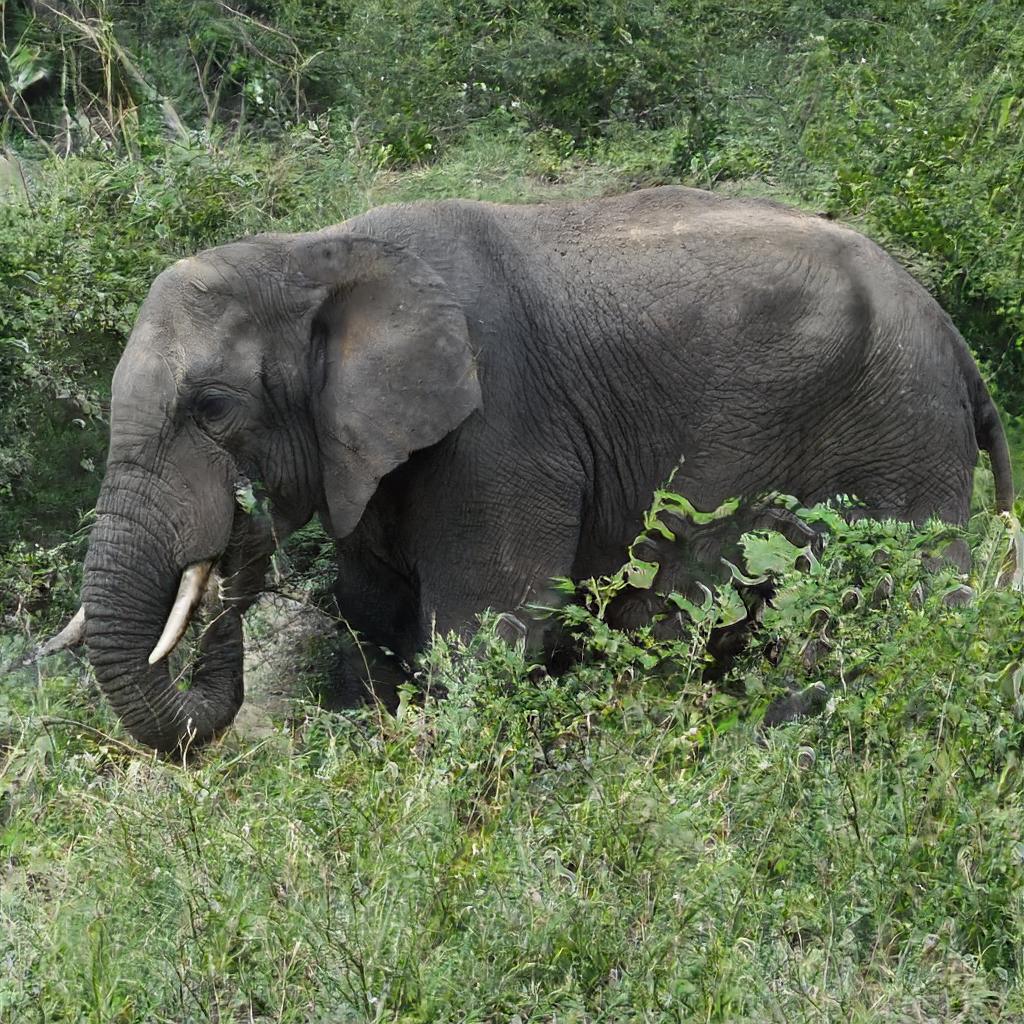
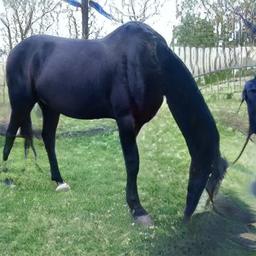
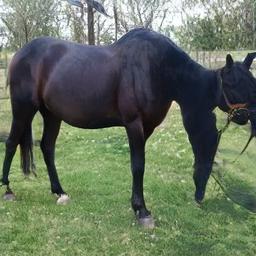
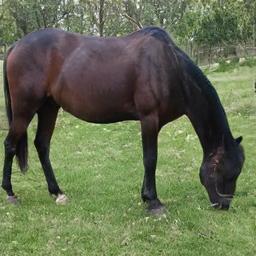
Our Results - Random Samples
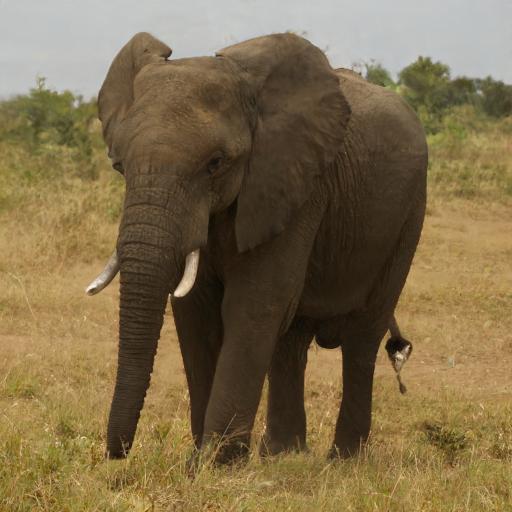
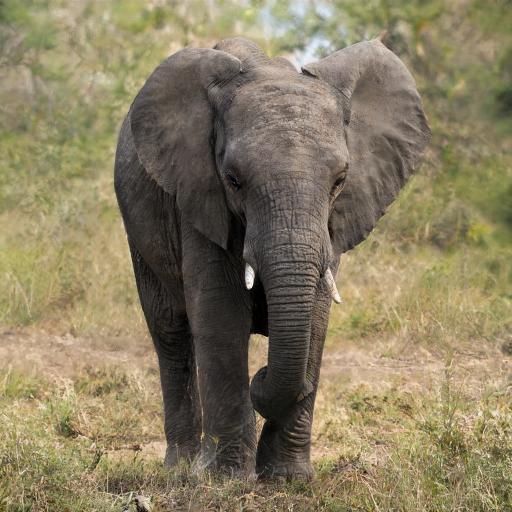
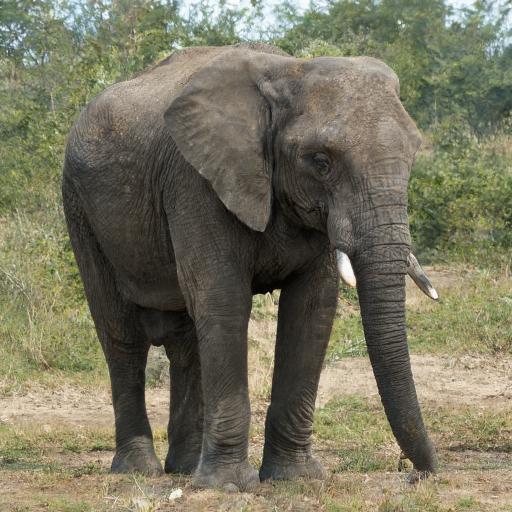
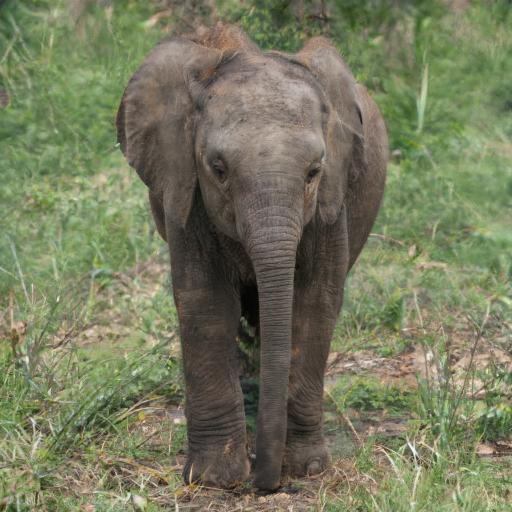
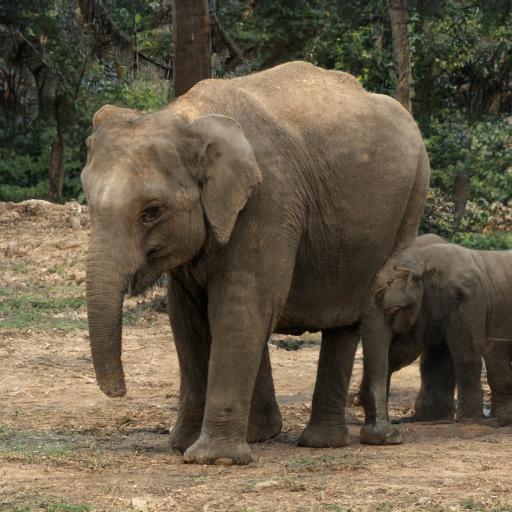
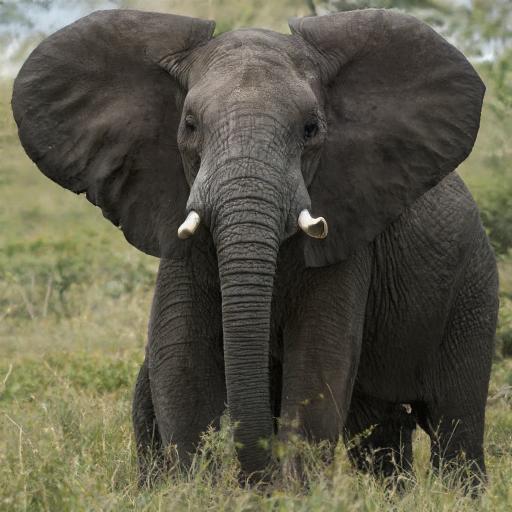
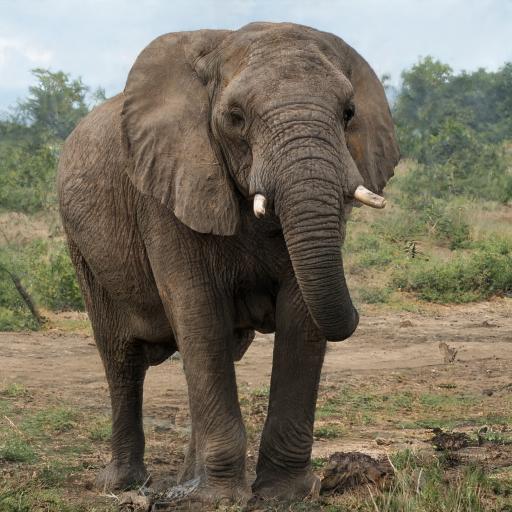
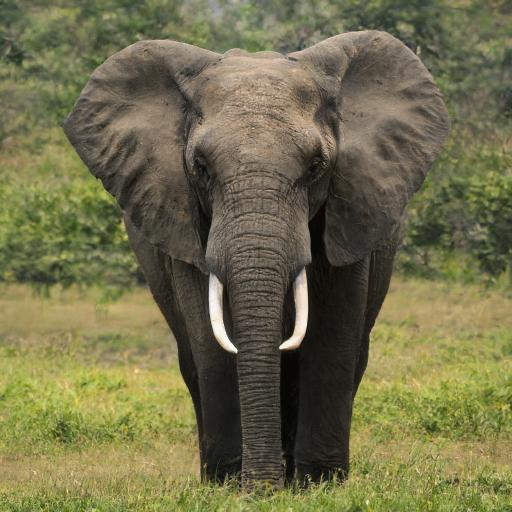
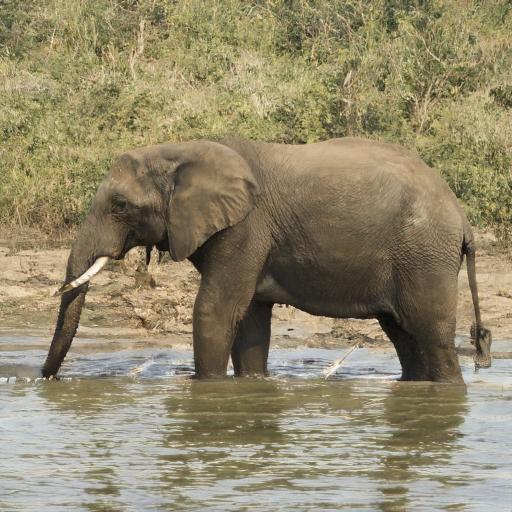
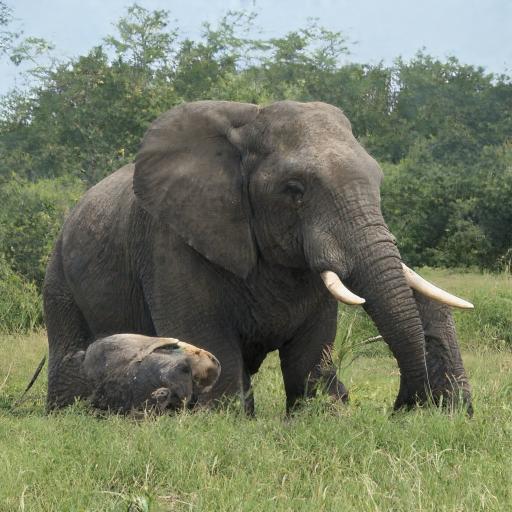
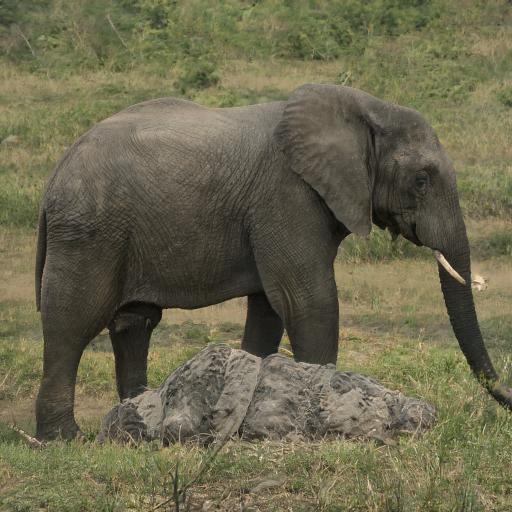
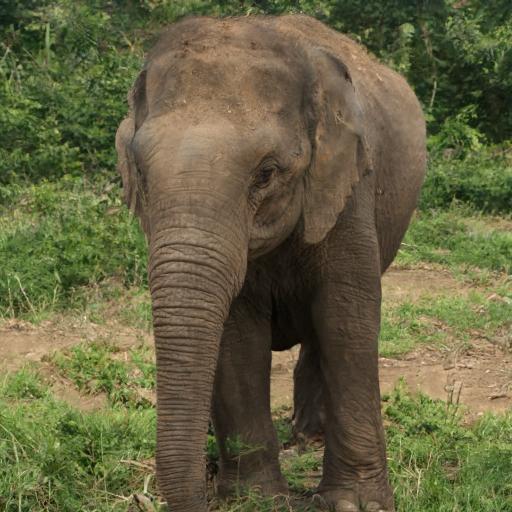
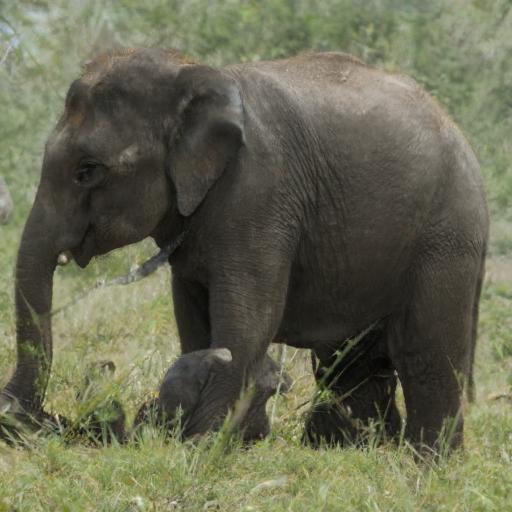
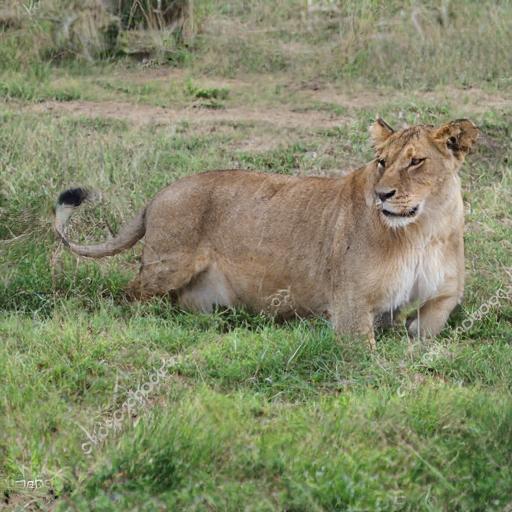
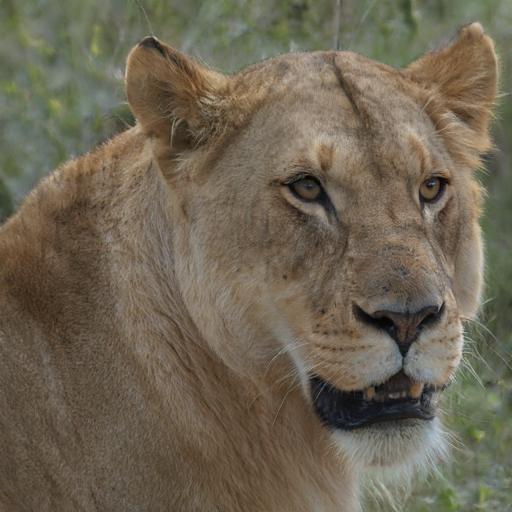
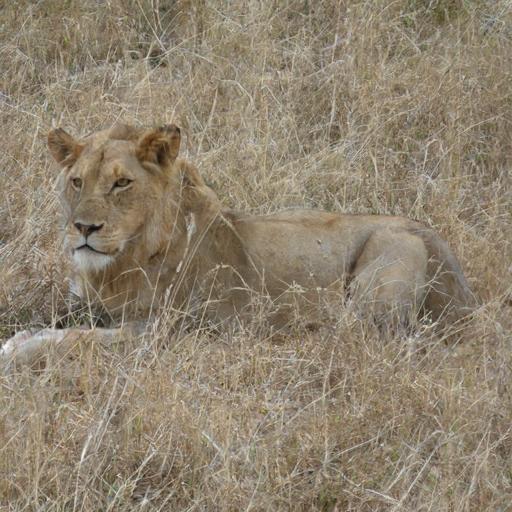
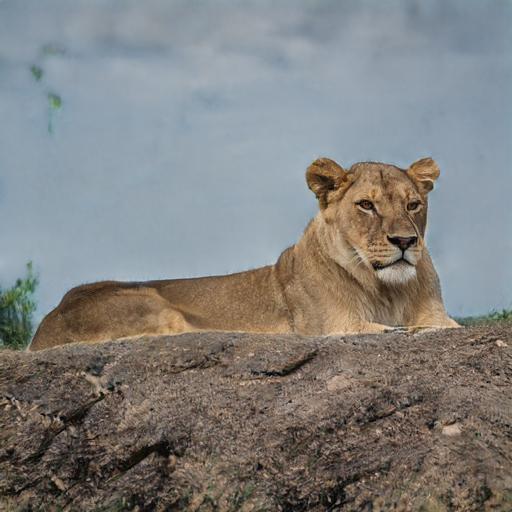
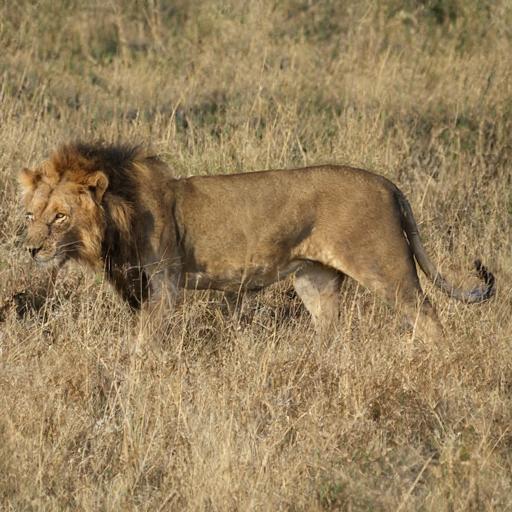
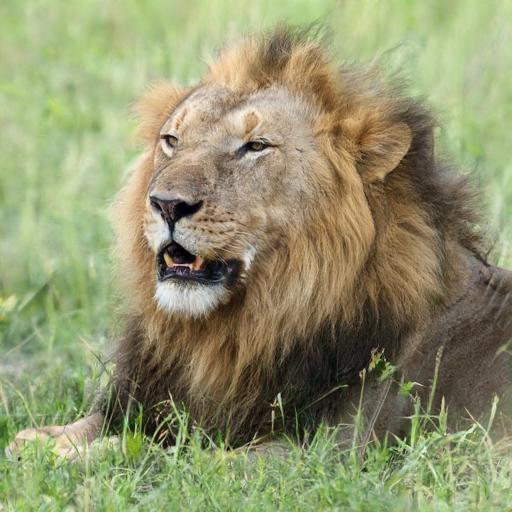
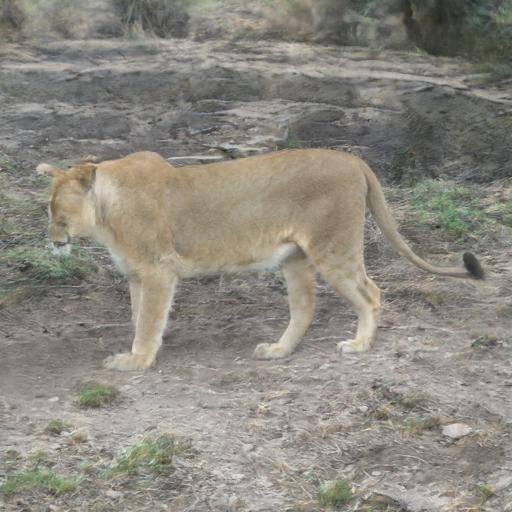
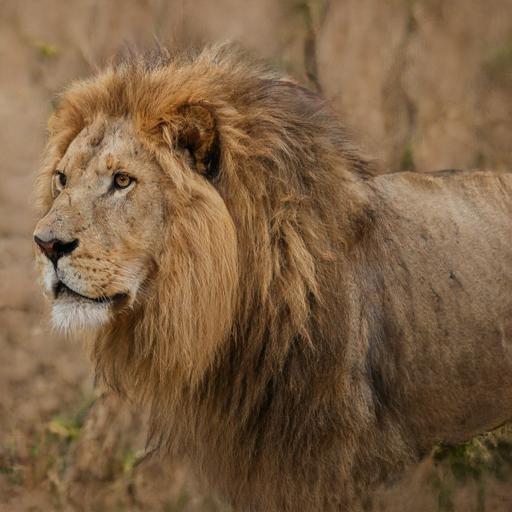
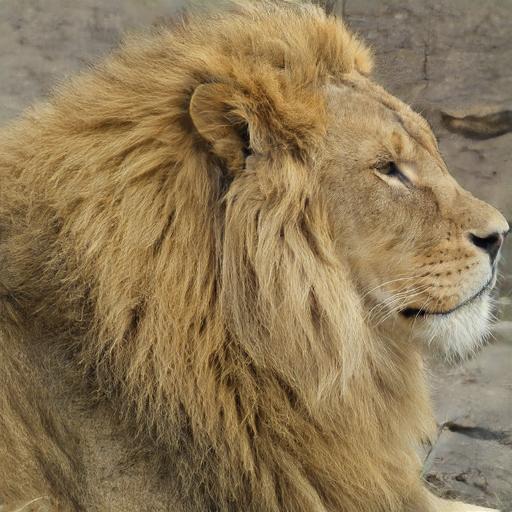
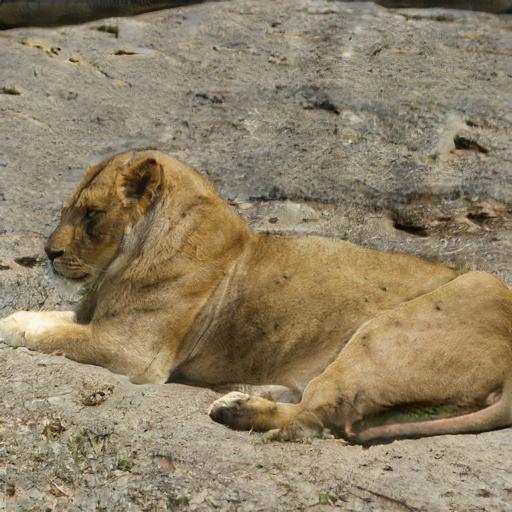
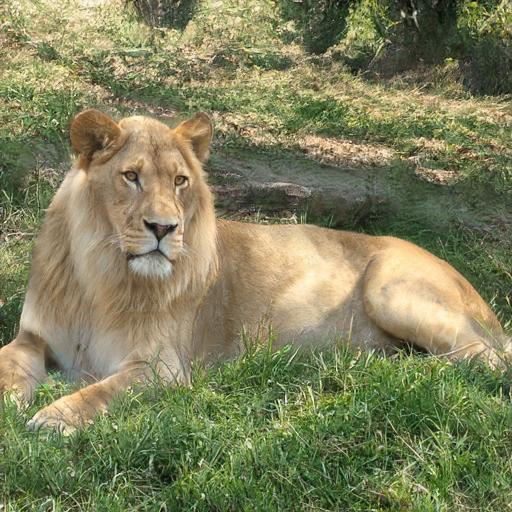
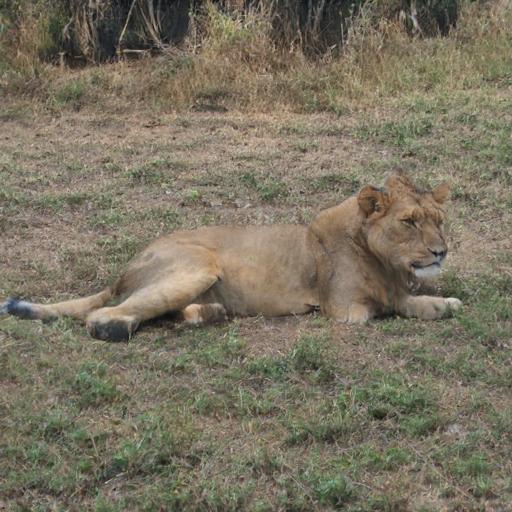
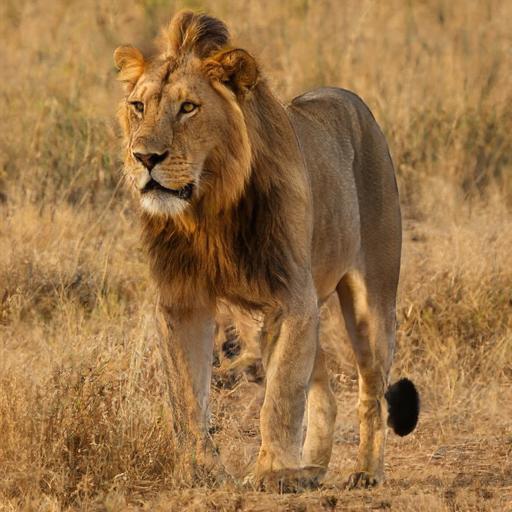
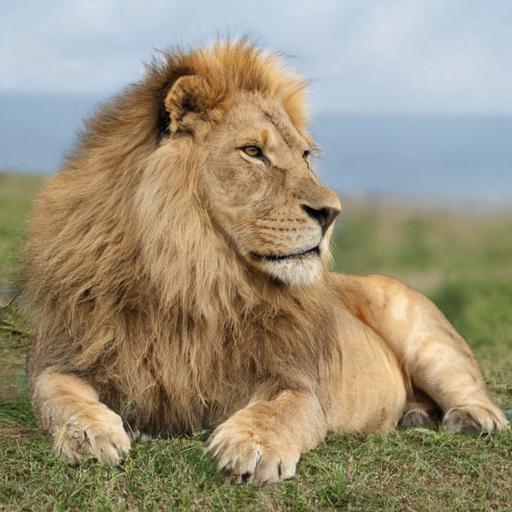
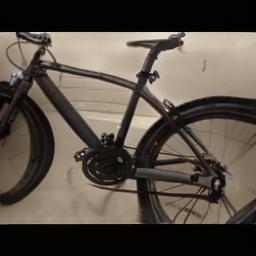
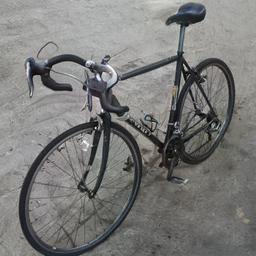
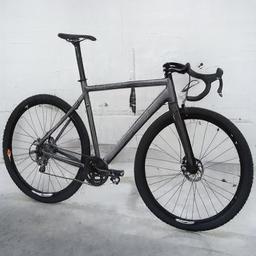
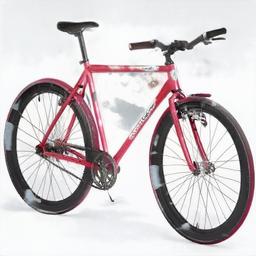
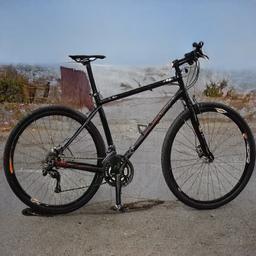
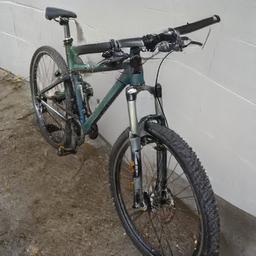
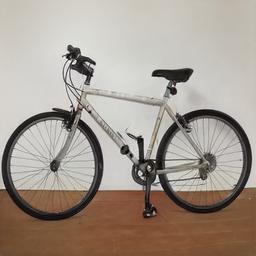
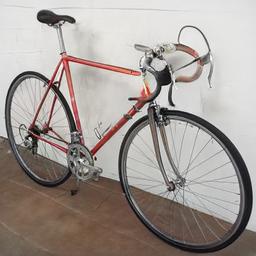
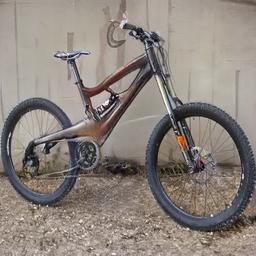
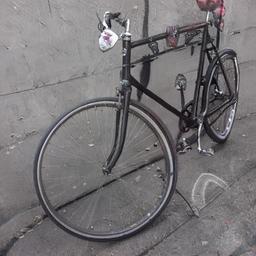
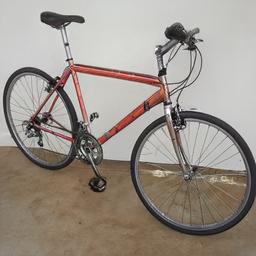
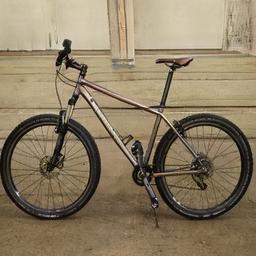
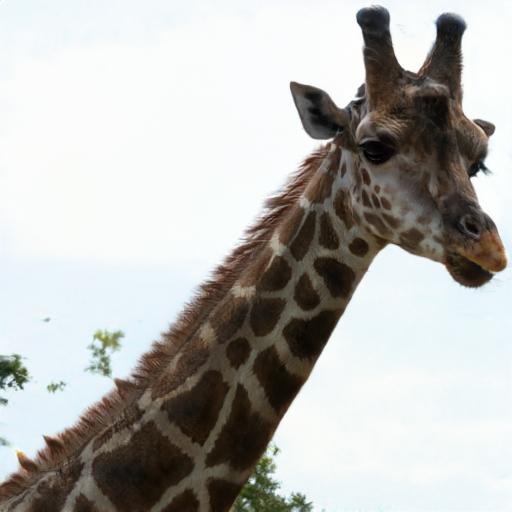
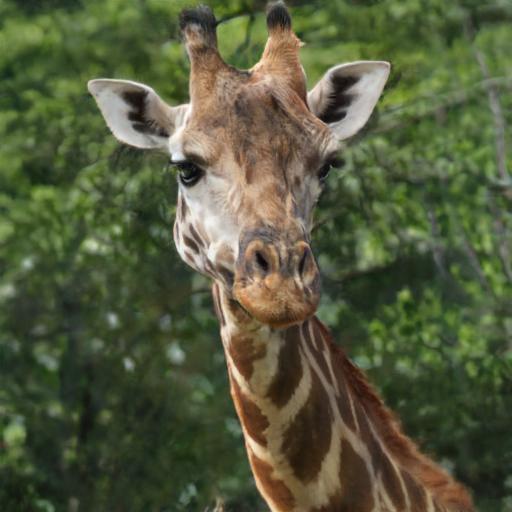
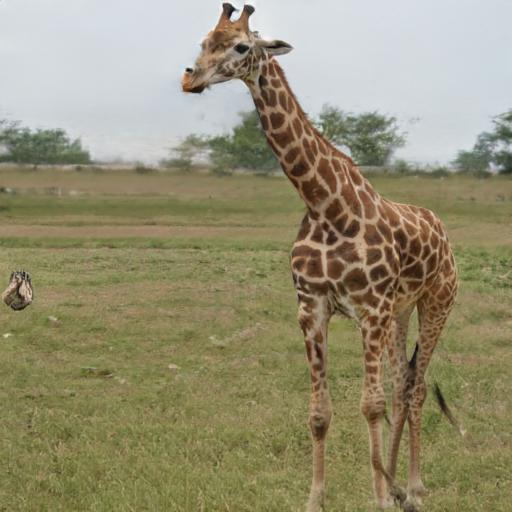
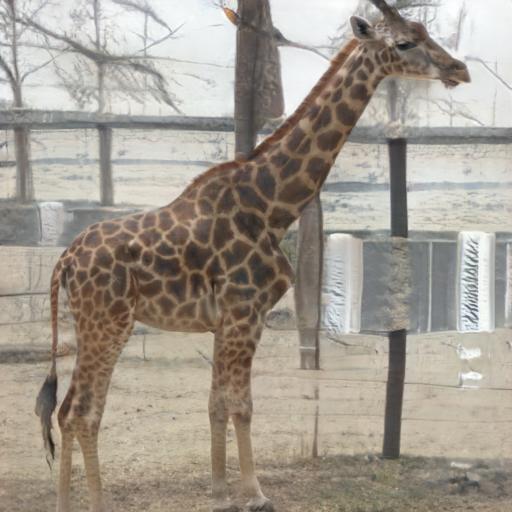
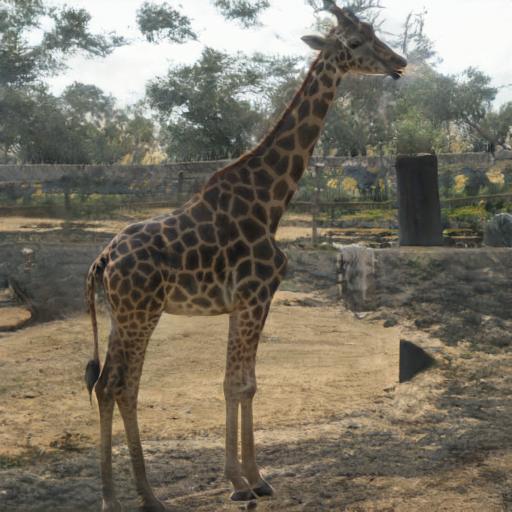
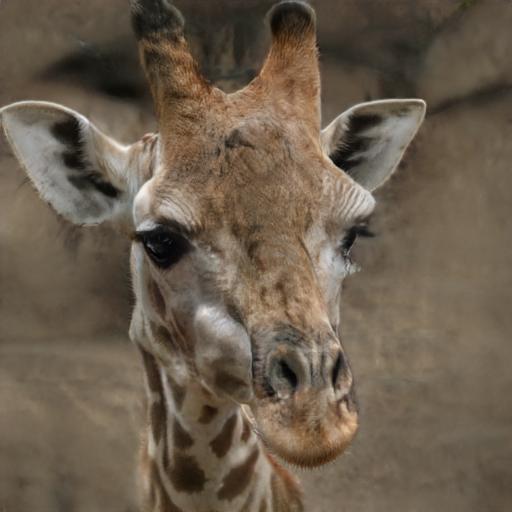
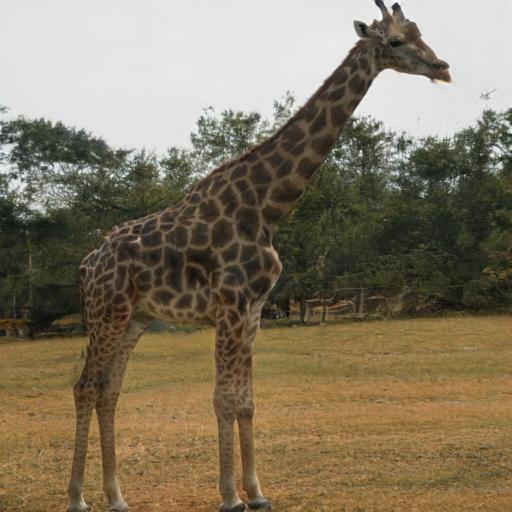
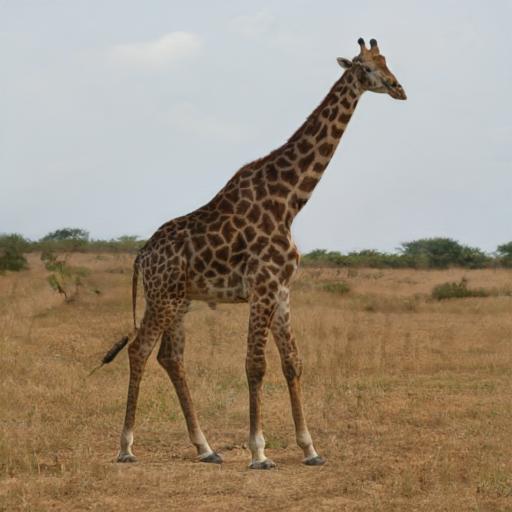
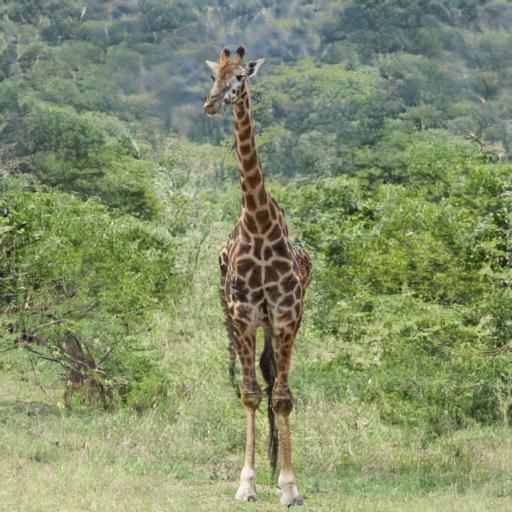
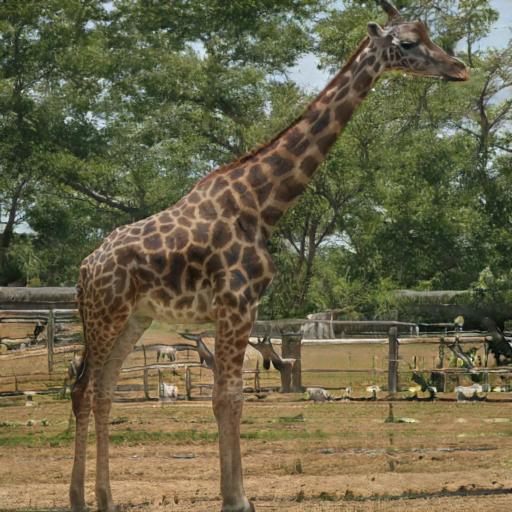
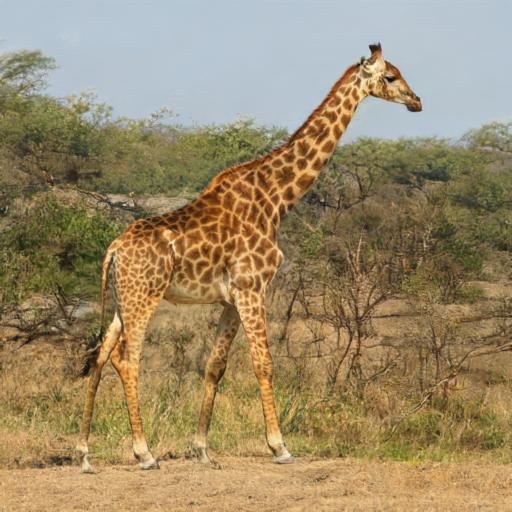
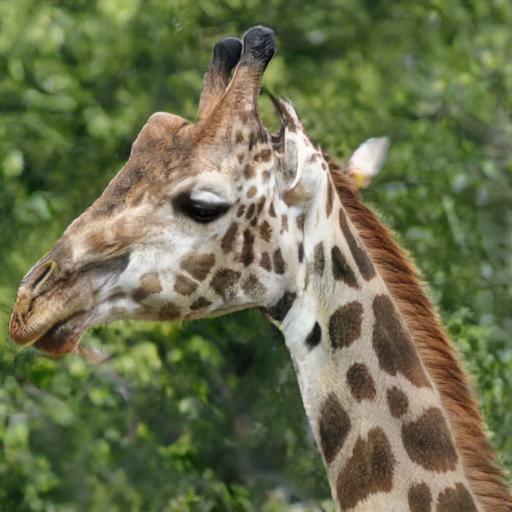
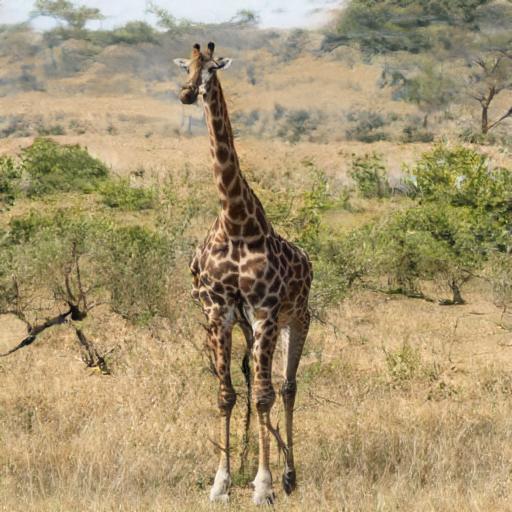
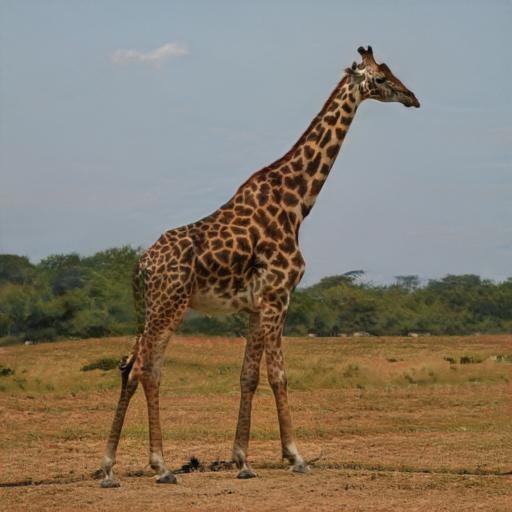
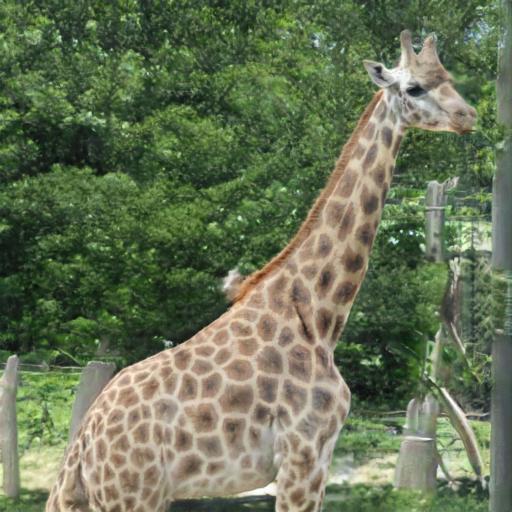
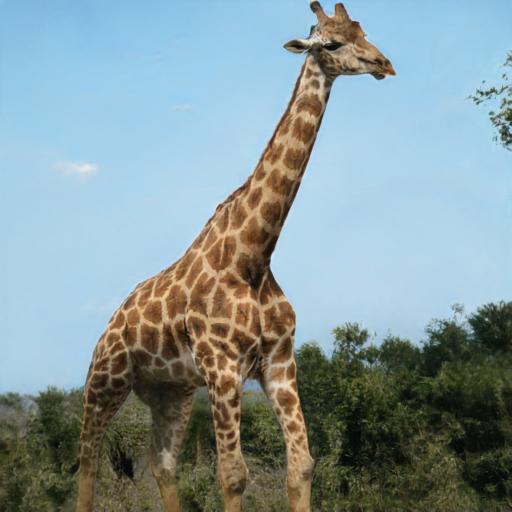
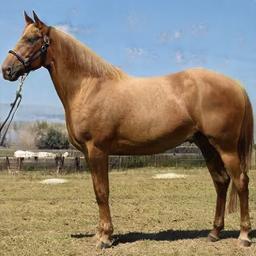
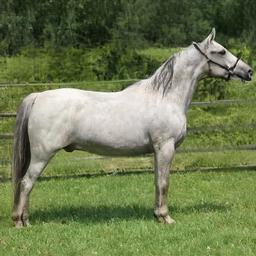
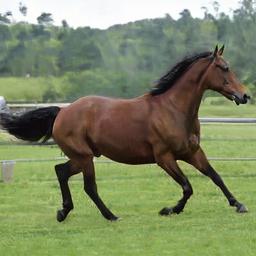
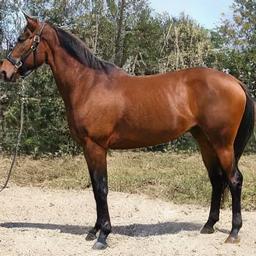
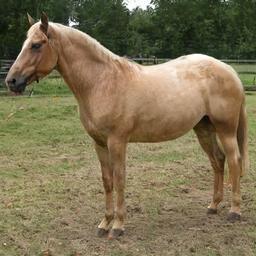
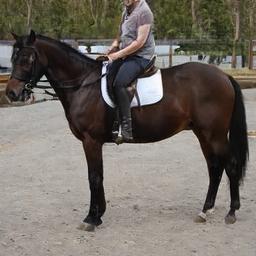
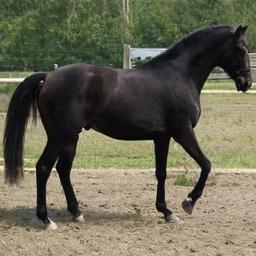
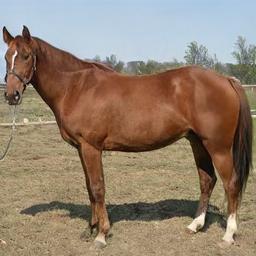
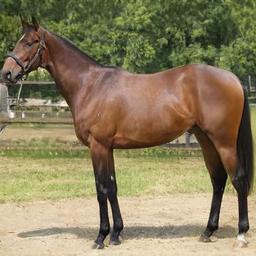
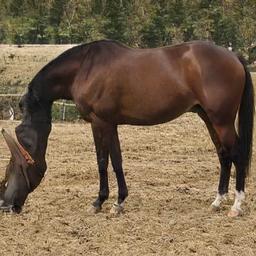
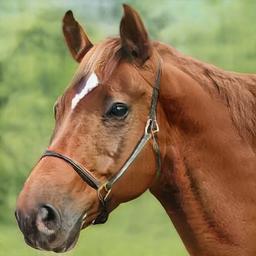
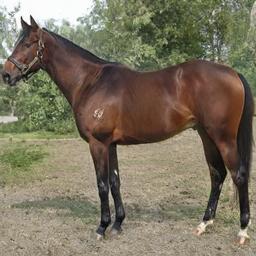
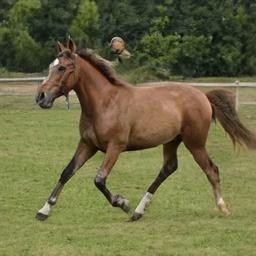
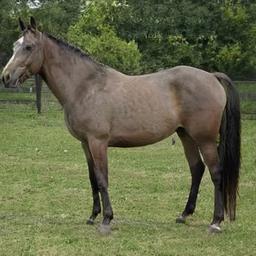
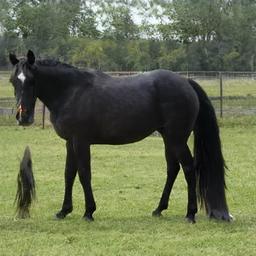
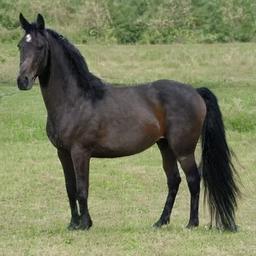
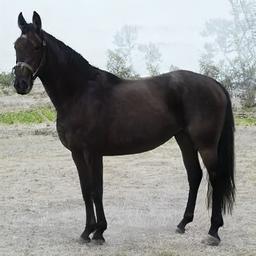
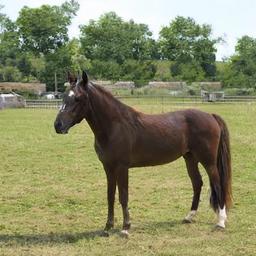
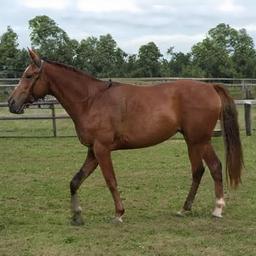
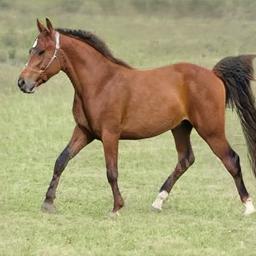
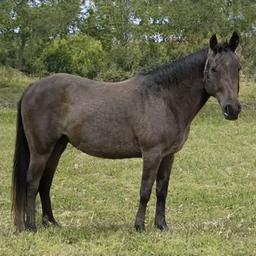
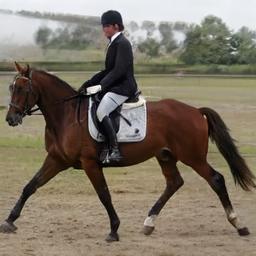
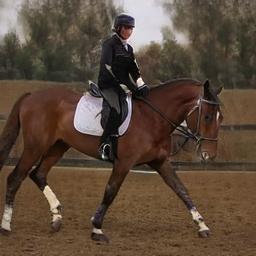
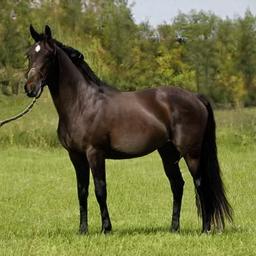
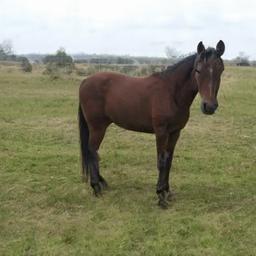
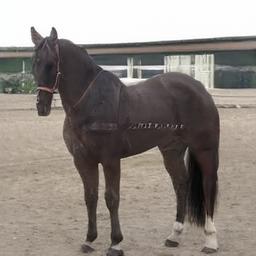
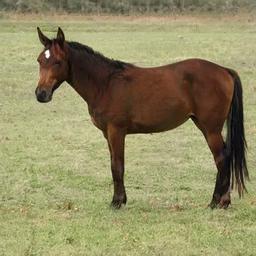
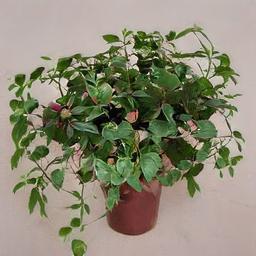
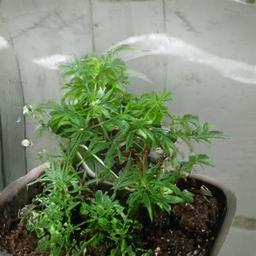
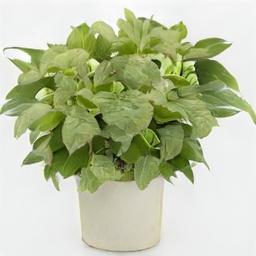
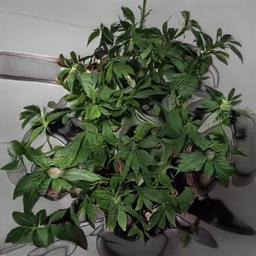
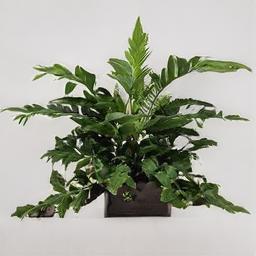
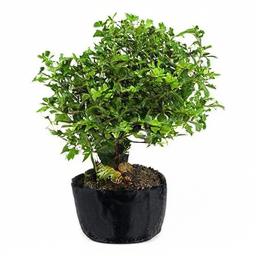
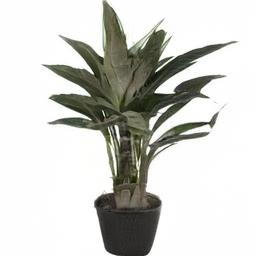
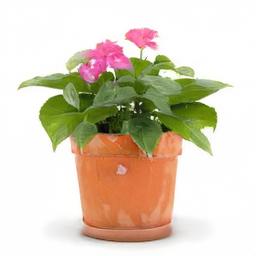
We show randomly sampled (uncurated) images generated by our method for various domains. The results below were generated using models that were trained for 500k-1500k iterations.
We used our multi-modal truncation, with 𝜓=0.5 for the Dogs, Elephants, Lions, Giraffes and Horses domains, and 𝜓=0.5 for the Potted-Plants, Bicycles and Parrots domains.
NOTE: We reccomend viewing all content in full screen. Click on the images for viewing them in full size.
Internet Dogs
|
|
|
|
|
|
|---|---|---|---|---|---|
|
|
|
|
|
|
|
|
|
|
|
|
|
|
|
|
|
|
|
|
|
|
|
|
Internet Elephants
|
|
|
|
|
|
|---|---|---|---|---|---|
|
|
|
|
|
|
|
|
|
|
|
|
|
|
|
|
|
|
|
|
|
|
|
|
Internet Lions
|
|
|
|
|
|
|---|---|---|---|---|---|
|
|
|
|
|
|
|
|
|
|
|
|
|
|
|
|
|
|

|
|
|
|
|
|
Internet Parrots
|
|
|
|
|
|
|---|---|---|---|---|---|
|
|
|
|
|
|
|
|
|
|
|
|
|
|
|
|
|
|
|
|
|
|
|
|
LSUN-Bicycle
|
|
|
|
|
|
|---|---|---|---|---|---|
|
|
|
|
|
|
|
|
|
|
|
|
|
|
|
|
|
|
|
|
|
|
|
|
Internet Giraffes
|
|

|
|
|
|
|---|---|---|---|---|---|
|
|
|
|
|
|
|
|
|
|
|
|
|
|
|
|
|
|
|
|
|
|
|
|
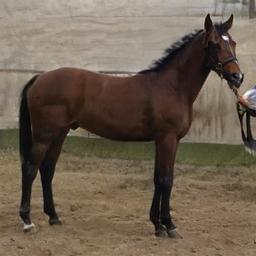
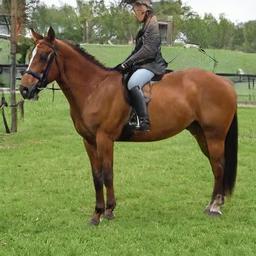
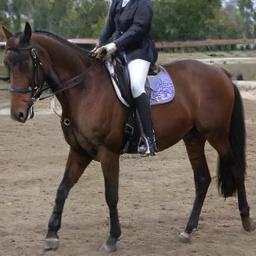
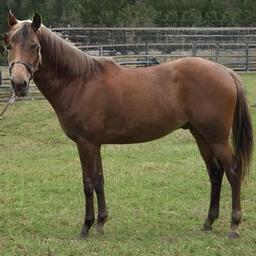
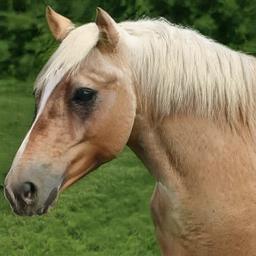
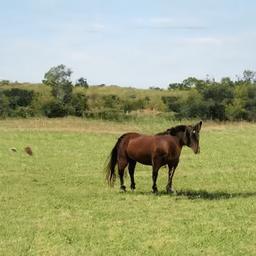
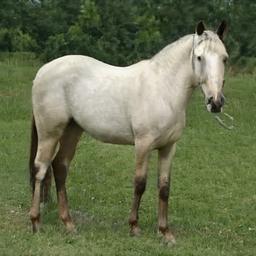
LSUN-Horse
|
|
|
|
|
|
|---|---|---|---|---|---|
|
|
|
|
|
|
|
|
|
|
|
|
|
|
|
|
|
|
|
|
|
|
|
|
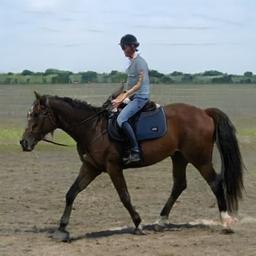
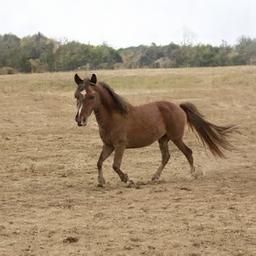
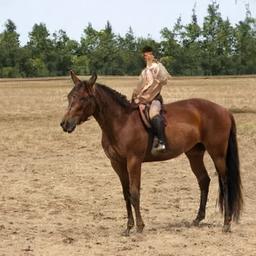
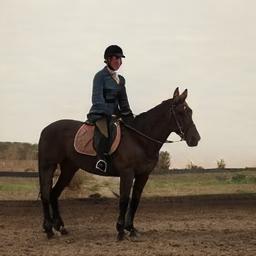
LSUN-Horse Uncropped (i.e. without cropping the main objects from each image in the dataset)
|
|
|
|
|
|
|---|---|---|---|---|---|
|
|
|
|
|
|
|
|
|
|
|
|
|
|
|
|
|
|
|
|
|
|
|
|
LSUN-Potted plants
|
|
|
|
|
|
|---|---|---|---|---|---|
|
|
|
|
|
|
|
|
|
|
|
|
|
|
|
|
|
|
|
|
|
|
|
|
Editing (Section 5.3)
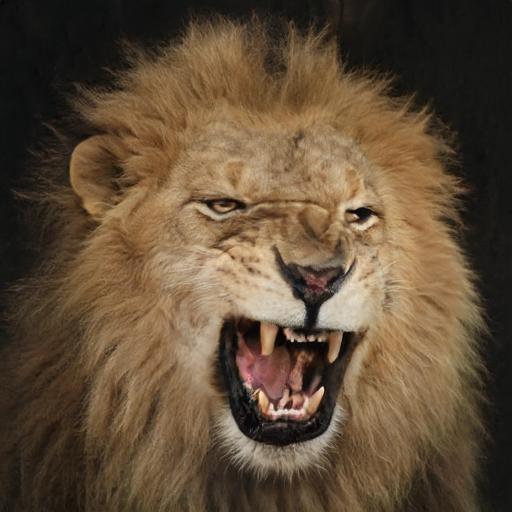
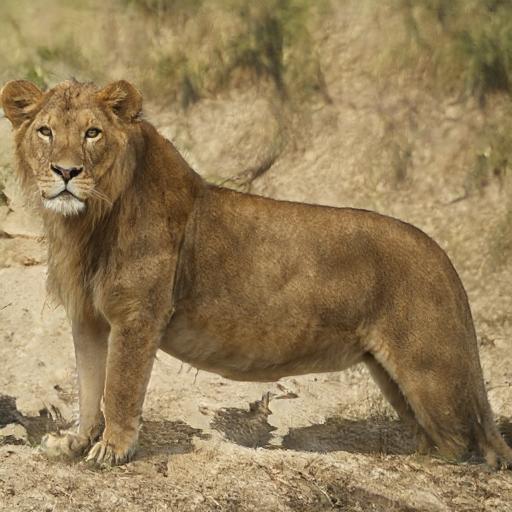
We show additional results for semantic image editing using our trained models. Here we visualize as animated GIFs a few editing directions we extracted in W space and in Style-Space of StyleGAN. As can be seen below, our method preserves StyleGAN's remarkable semantic editing capabilities in challenging, multi-modal domains.
NOTE: We reccomend viewing all content in full screen. Click on the images for viewing them in full size.
Lions
| Add / Remove Mane | |||
|---|---|---|---|
|
|
|

|
|
|
|

|
|
|
|

|
|
|
|
|
| Head Pane Rotation | |||
|
|
|
|
|
|
|
|
|
|
|
|
|
|
|
|
| Roaring | |||
|
|
|
|

|

|

|

|
Parrots
| Head Pan Rotation | |||
|---|---|---|---|

|
|
|
|
|
|
|
|
|
|
|
|
| Beak Color | |||
|
|
|
|
| Zoom In/Out | |||
|
|
|
|
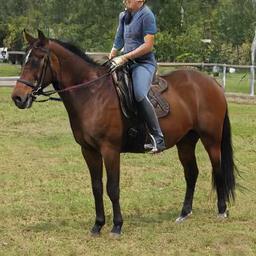
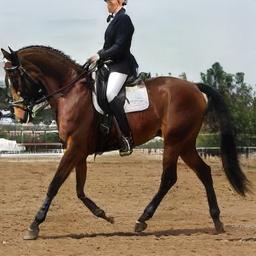
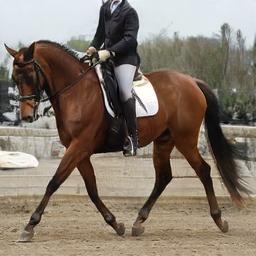
Horses
| Head Pan Rotation | |||||
|---|---|---|---|---|---|
|
|
|
|
||
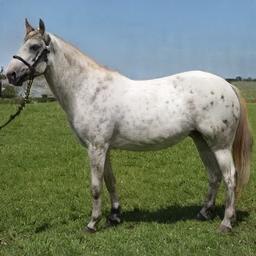
| Horse Color (White / Brown) | |||||
|
|
|
|
||
| Horse Running / Standing Still | |||||
|
|
|
|
||
| Head Up / Down | |||||
|
|
|
|
||
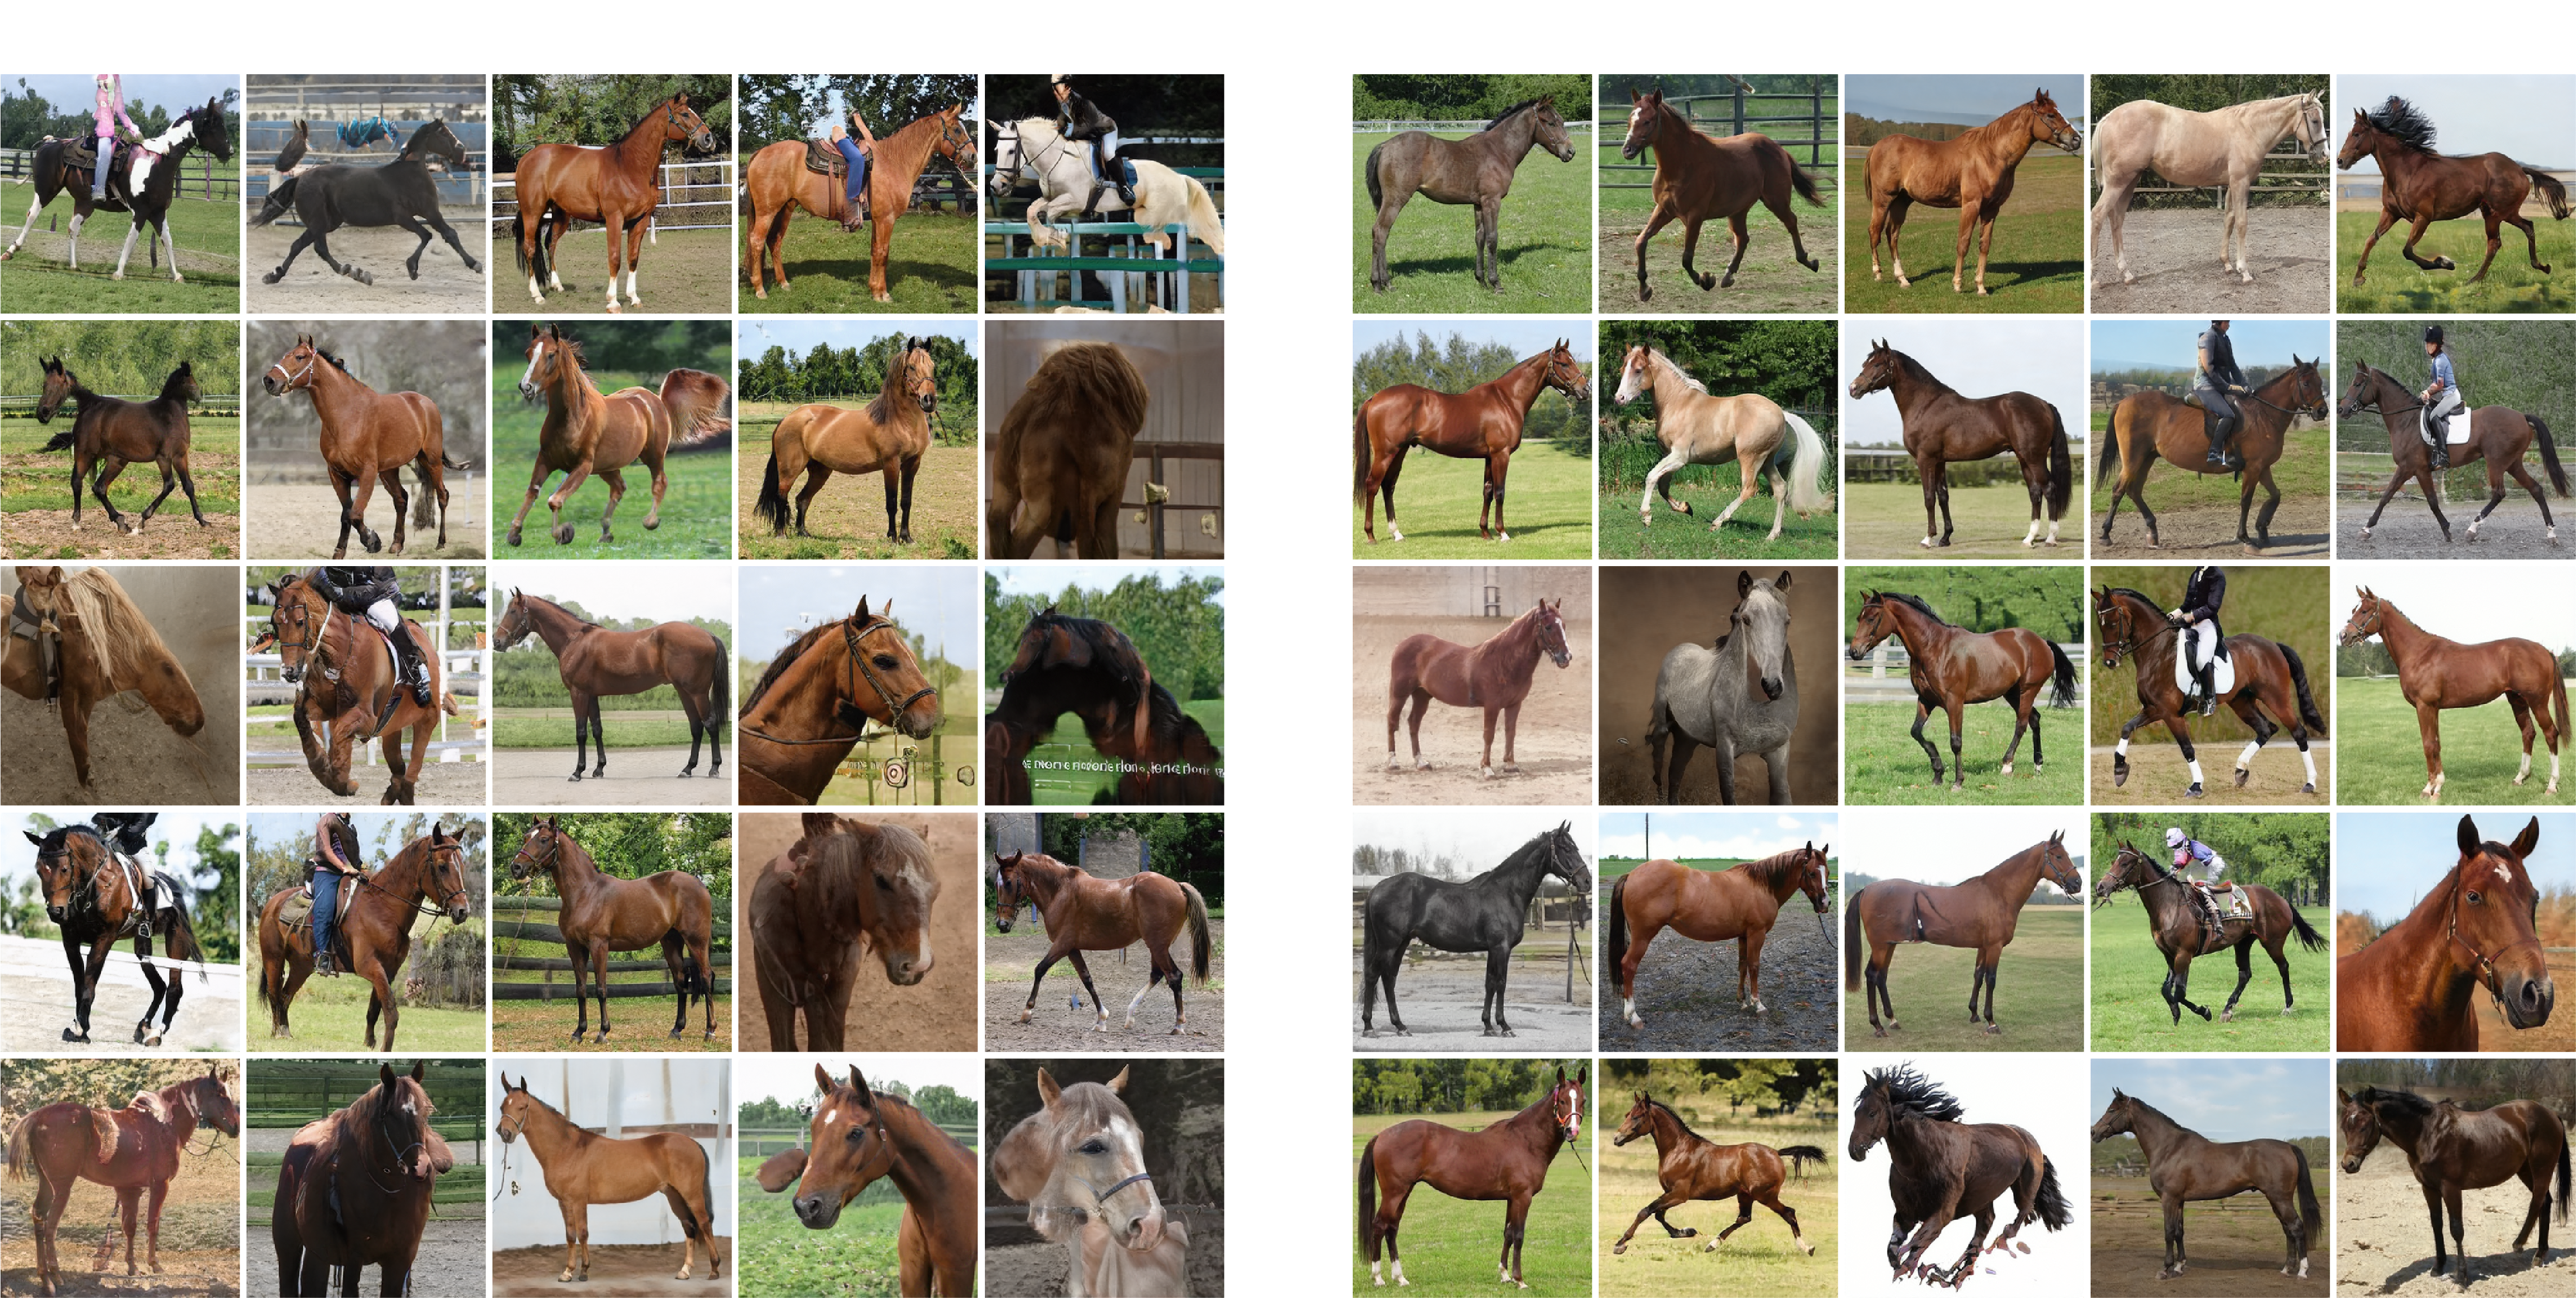
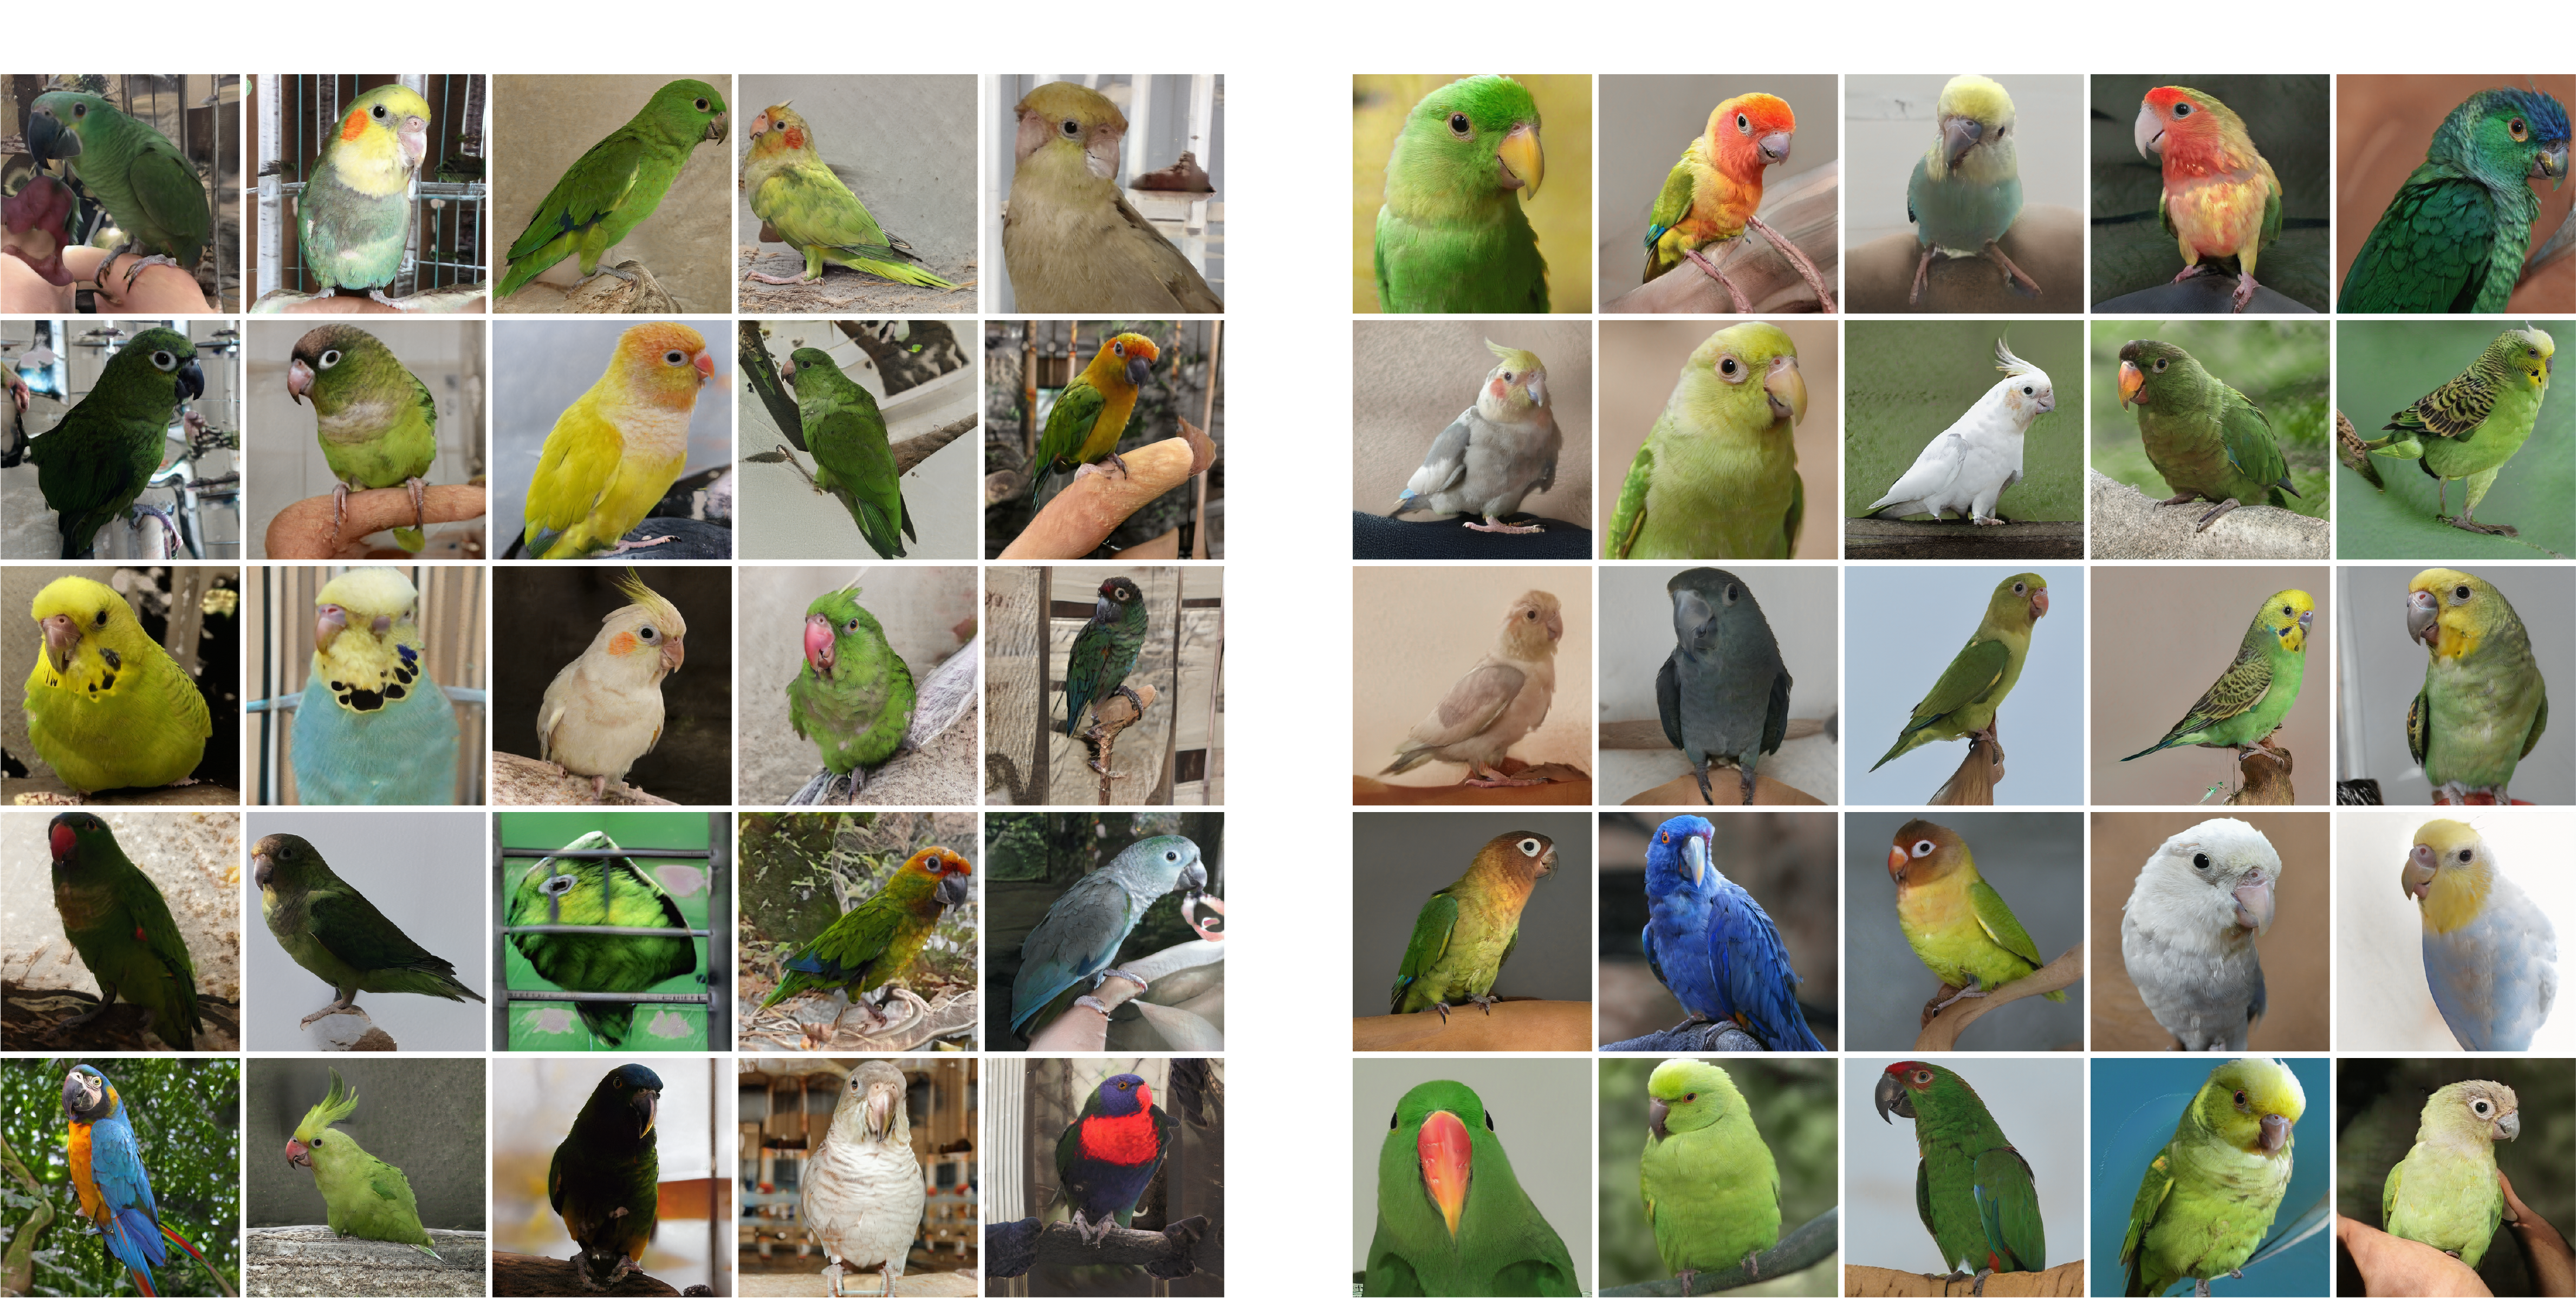
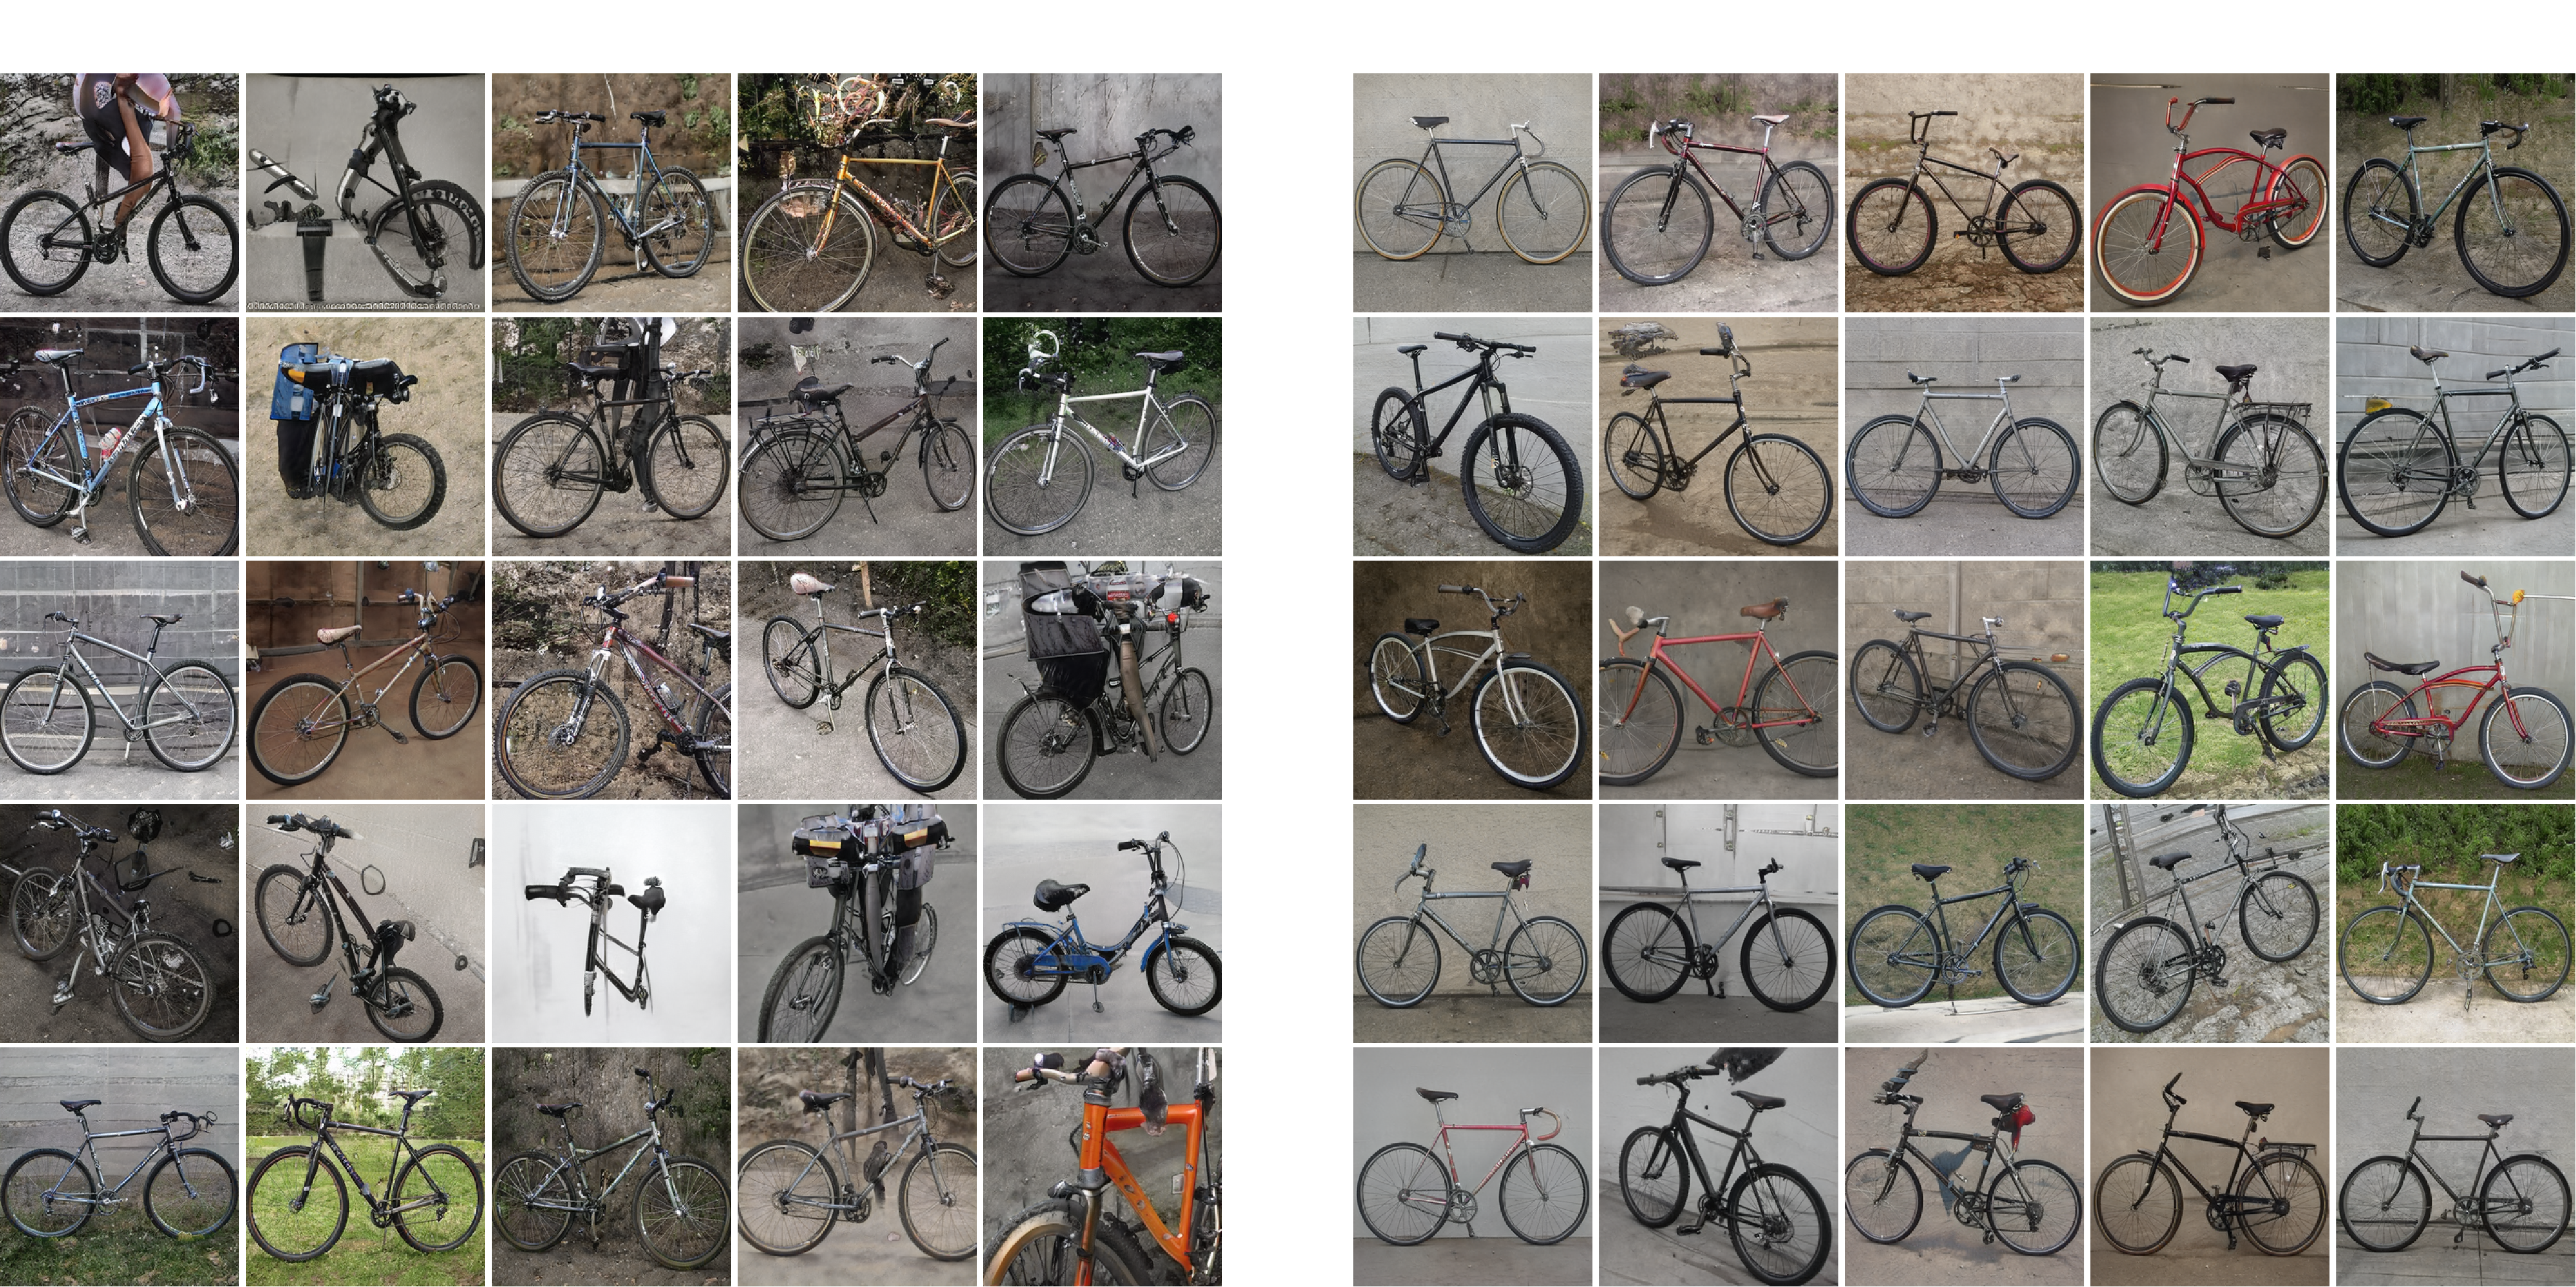
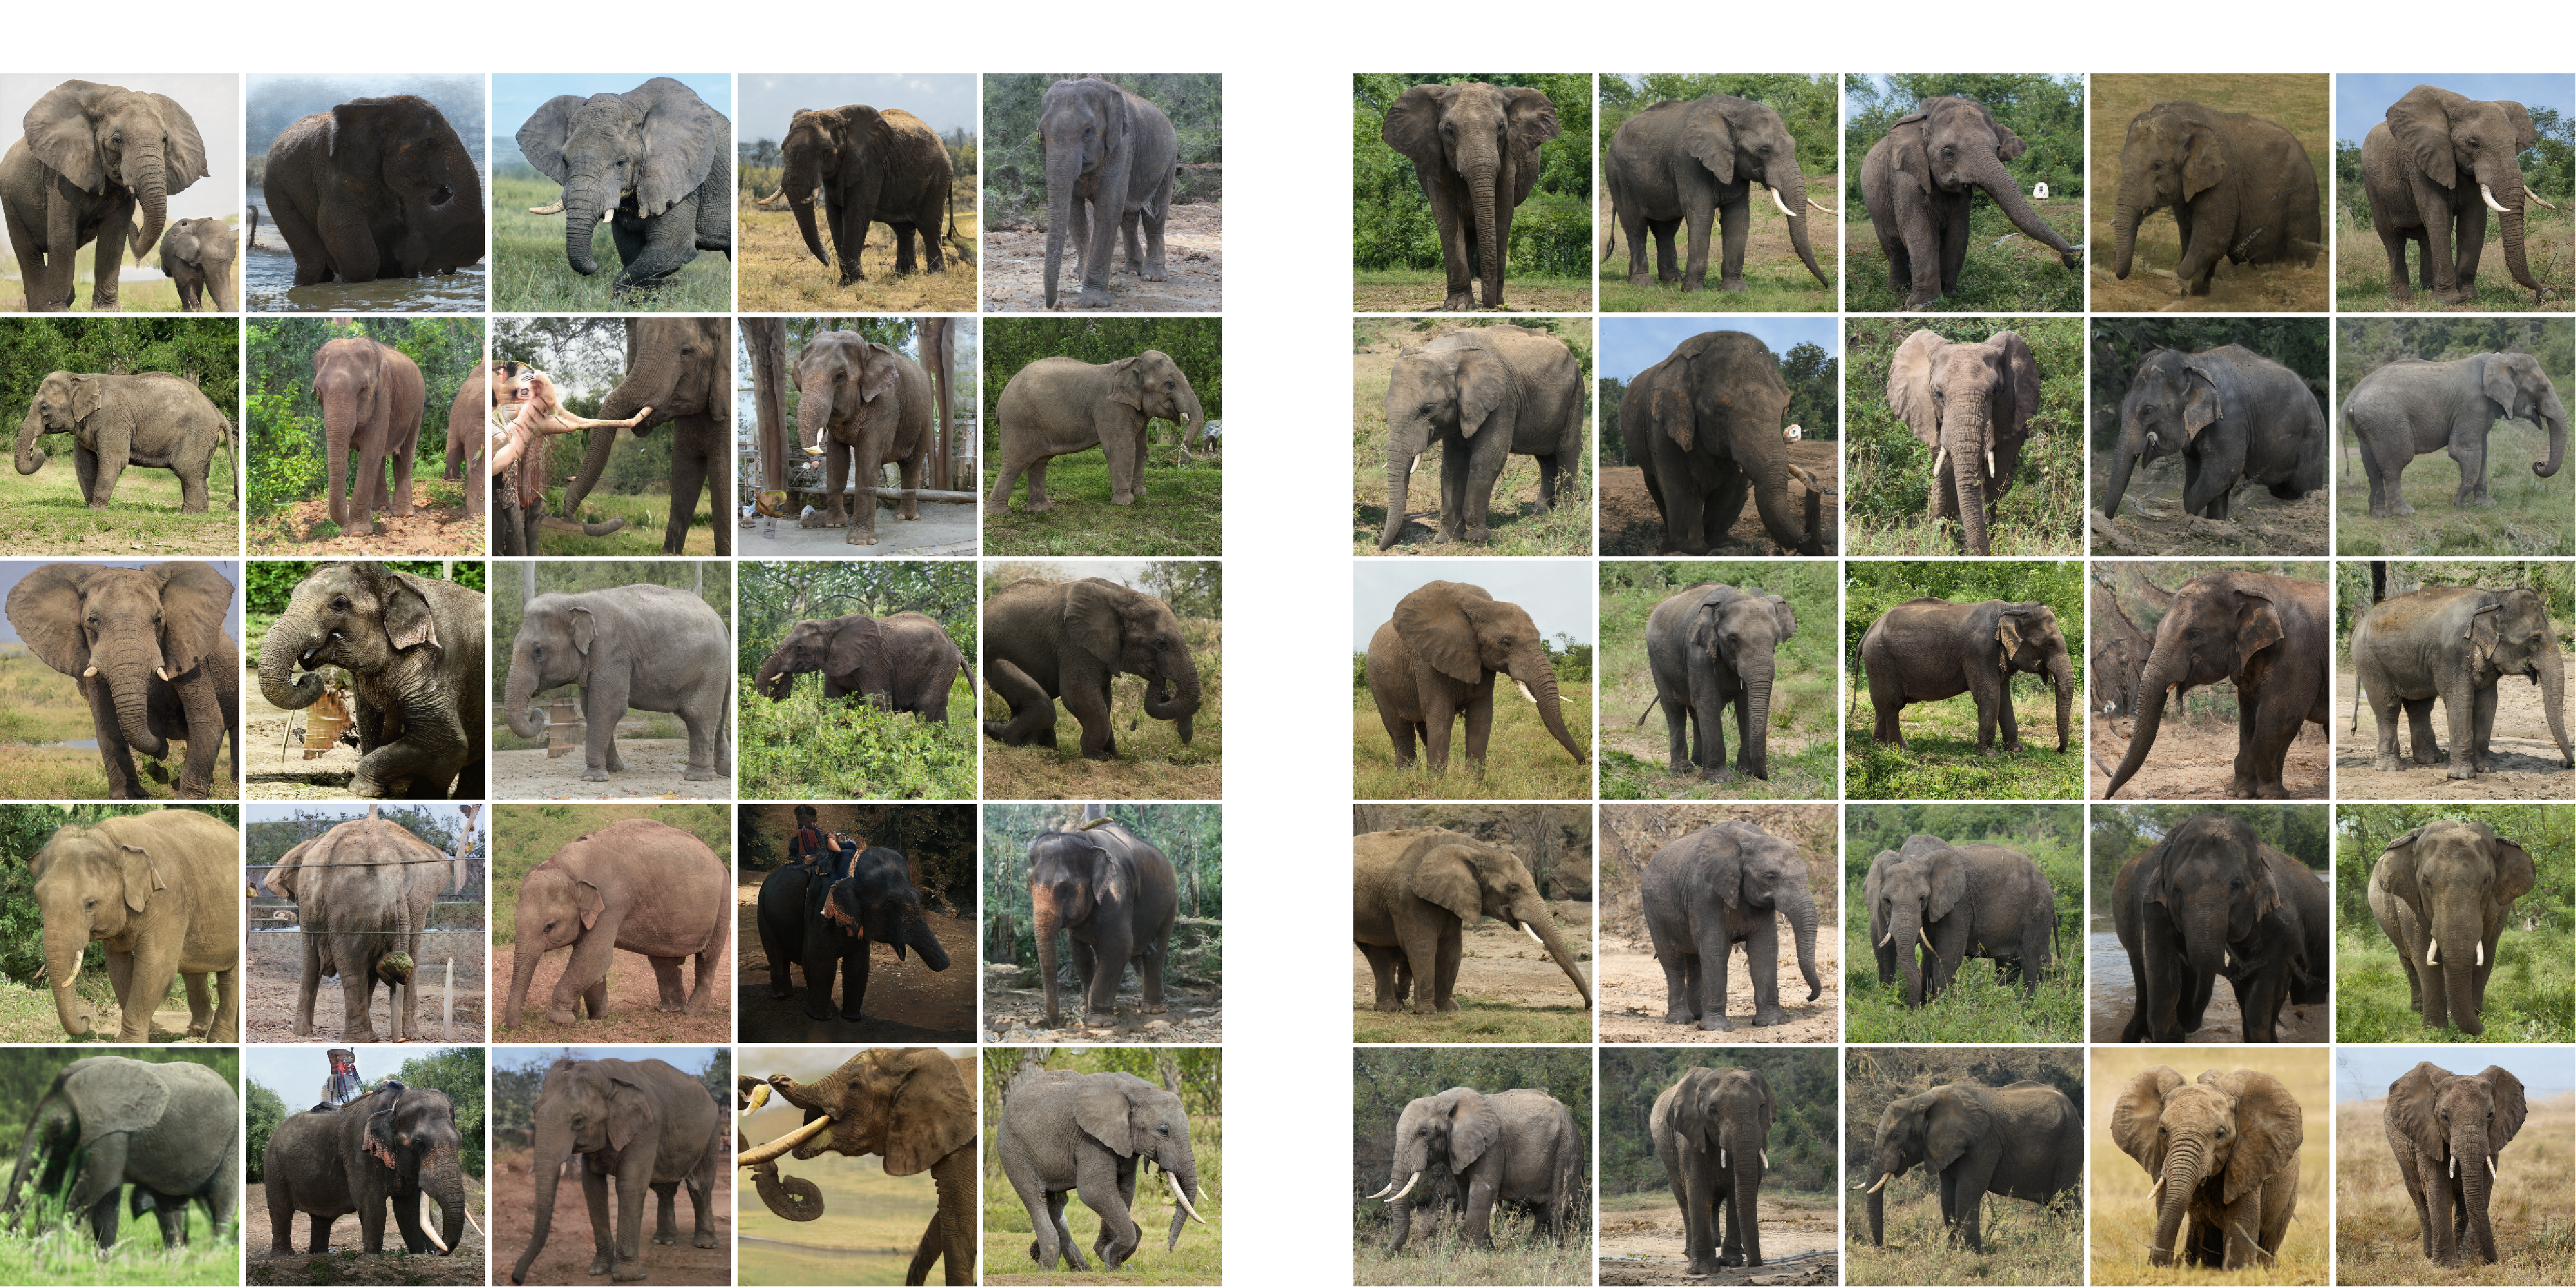
Self-Filtering Qualitative Comparison (Section 5.1)
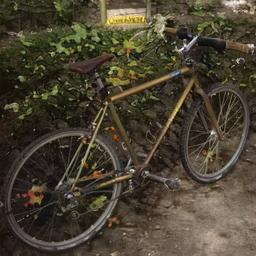
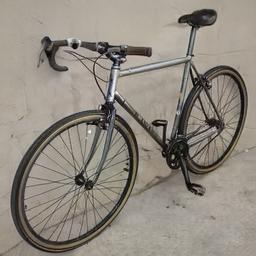
We show additional results of random images generated by: StyleGAN trained on unfiltered data (left), and StyleGAN trained on data self-filtered by our method (right). For fair comparison, we trained both models the same number of iterations (500k iterations).
LSUN-Horse
Internet Parrots
Internet Bikes
Internet Elephants
Quantitative Comparisons - User Study (Sections 5.1, 5.2)
Realism User Study
We further evaluate the realism and visual quality of our results by performing an extensive user study using Amazon Mechanical Turk (AMT). We follow a typical protocol used for evaluating the overall realism and quality of images generated in an unconditional manner: a single image is displayed for 1.5 seconds, after which the participant decides whether the image is real or fake. Each rater receives 60 randomly picked images, out of which: 20 were synthesized by StyleGAN generator trained on the filtered subset, 20 synthesized by the generator trained on the unfiltered collection, and 20 real images. We filter the results of raters who failed 2 or more vigilance tests, or marked more than 40% of the real images as fake. Finally, we report the percentage of images marked as real for each generator.
The following is an illustration of the realism user study.
| Image displayed for 1.5 seconds | Real/Fake selection | |
|
|
Was the image real or fake?
|
Truncation Comparison User Study
The goal of this test is to compare the image quality under different truncation methods. In each study, the outcome of the compared methods are presented side-by-side without a time limit. The participants are asked to choose the most realistic image. Each rater is given a random subset of 20 such questions (images in each question are all originated from the same latent code) with random order between the different methods.
The following is the template displayed to the raters when comparing 3 methods: no truncation, mean truncation, and our truncation.
Which image looks more realistic?
Look for artifacts in the main object or its surrounding.
And the following is the template displayed to the raters when comparing mean clamping and our method.
Which image looks more realistic?
Look for artifacts in the main object or its surrounding.